
Agricultural Commodity Market Report 2026
Global Outlook – By Product (Soybeans, Corn, Wheat, Rice, Cocoa, Coffee, Cotton, Spices, Other Products), By Trading (Online, Offline), By End User (Business To Business, Business To Consumer ) – Market Size, Trends, Strategies, and Forecast to 2030
Agricultural Commodity Market Overview
• Agricultural Commodity market size has reached to $6068.24 billion in 2025 • Expected to grow to $8674.03 billion in 2030 at a compound annual growth rate (CAGR) of 7.4% • Growth Driver: Rising Demand For Healthier Diets Driving Agricultural Market Growth • Market Trend: Innovative Soybean Seed Varieties Drive Sustainable Agriculture • North America was the largest region in 2025.Market Gains By 2030 – Top Opportunities By Segment
Market Gain identifies the most promising market opportunities by highlighting the segments or products expected to generate the highest incremental revenue growth over the next five years.
What Is Covered Under Agricultural Commodity Market?
An agricultural commodity is a raw product derived from farming and agriculture, used for consumption, trade, or further processing. These commodities are generally produced in large quantities and are fundamental to global trade and economies. The main products of the agricultural commodity are soybeans, corn, wheat, rice, cocoa, coffee, cotton, spices, and other products. Soybeans are legumes grown primarily for their protein-rich seeds used in various food and industrial products. They are key in livestock feed and processed foods like oils and soy milk. They are traded online and offline by different end users, including business-to-business and business-to-consumer.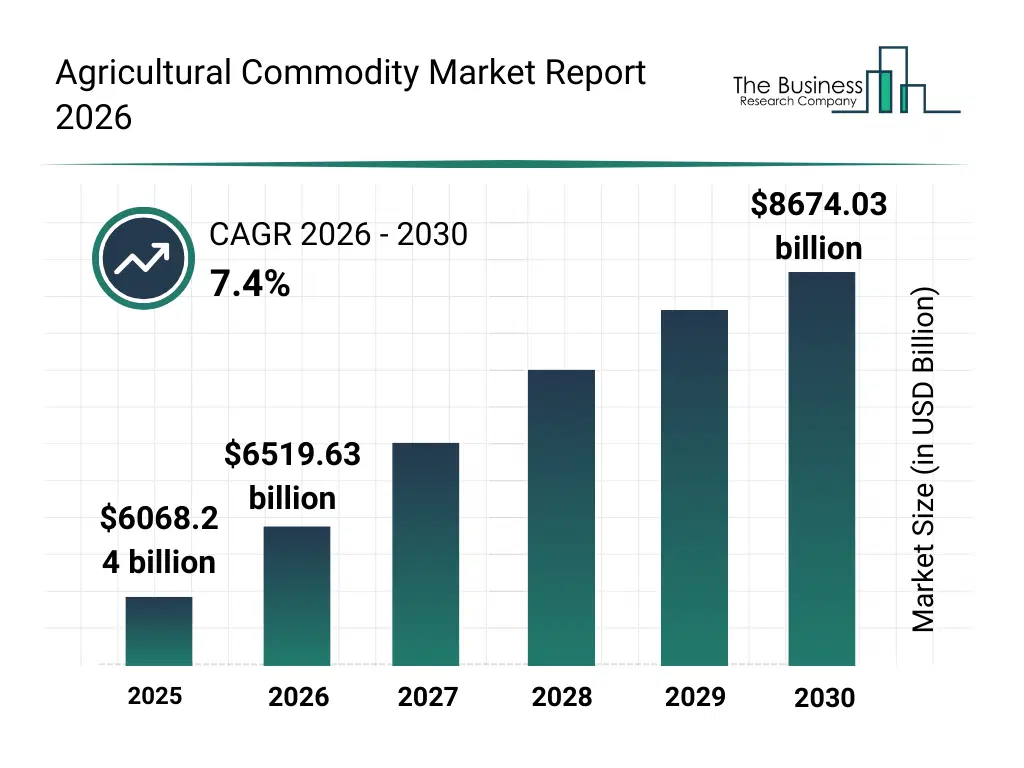
What Is The Agricultural Commodity Market Size and Share 2026?
The agricultural commodity market size has grown strongly in recent years. It will grow from $6068.24 billion in 2025 to $6519.63 billion in 2026 at a compound annual growth rate (CAGR) of 7.4%. The growth in the historic period can be attributed to expansion of global agriculture production, rise in international trade agreements, growing demand for staple foods, adoption of large-scale farming, price volatility driving market participation.What Is The Agricultural Commodity Market Growth Forecast?
The agricultural commodity market size is expected to see strong growth in the next few years. It will grow to $8674.03 billion in 2030 at a compound annual growth rate (CAGR) of 7.4%. The growth in the forecast period can be attributed to increasing climate-driven production shifts, growth in sustainable sourcing practices, rising demand from emerging economies, expansion of online commodity trading, improving supply chain transparency. Major trends in the forecast period include increasing global demand for staple agricultural commodities, expansion of commodity diversification in emerging markets, rising emphasis on quality grading and standardization, growth in organic and non-gmo commodity production, increasing cross-border commodity trading volumes.
Global Agricultural Commodity Market Segmentation
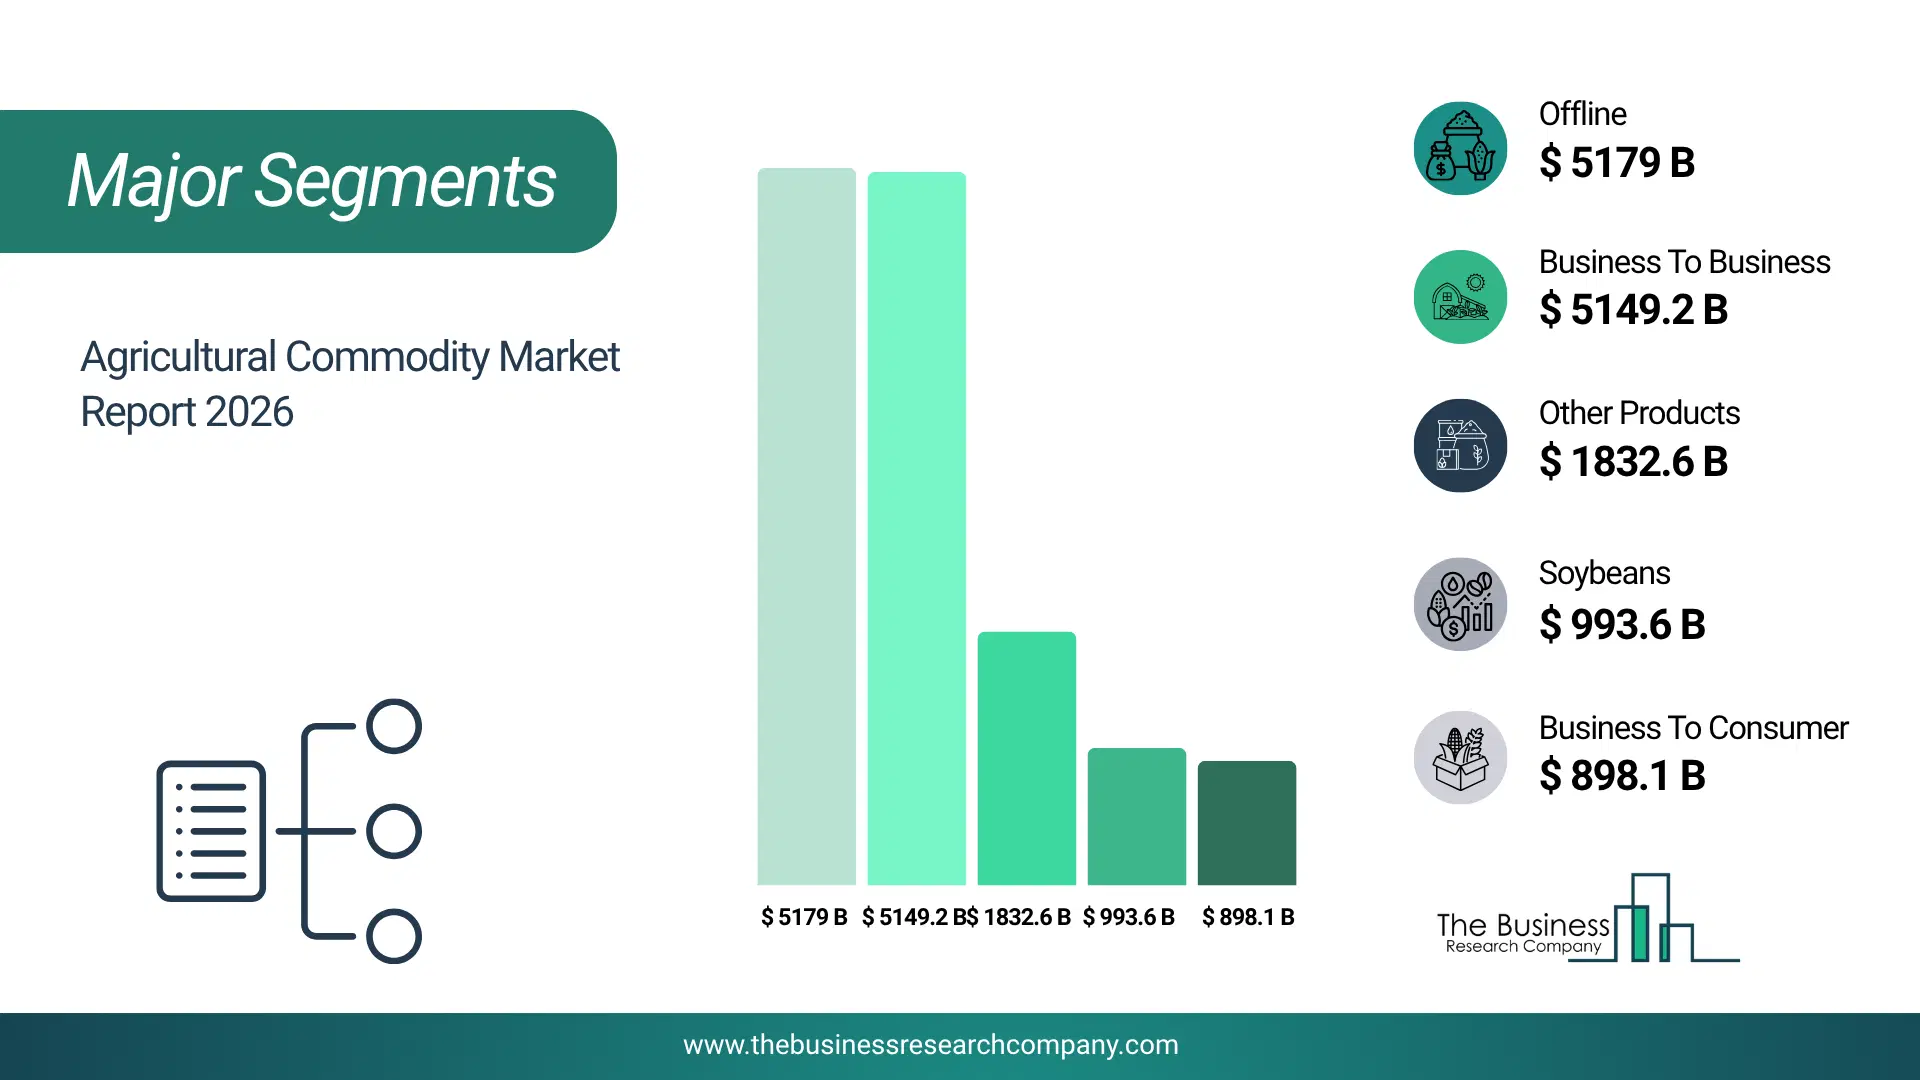
1) By Product: Soybeans, Corn, Wheat, Rice, Cocoa, Coffee, Cotton, Spices, Other Products 2) By Trading: Online, Offline 3) By End User: Business To Business, Business To Consumer Subsegments: 1) By Soybeans: Non-GMO Soybeans, GMO Soybeans 2) By Corn: Yellow Corn, White Corn, Sweet Corn, Other Varieties (Specialty Corn) 3) By Wheat: Hard Red Winter Wheat, Soft Red Winter Wheat, Hard Red Spring Wheat, Durum Wheat, Soft Wheat 4) By Rice: White Rice, Brown Rice, Basmati Rice, Jasmine Rice, Other Varieties (Glutinous Rice) 5) By Cocoa: Cocoa Beans, Cocoa Powder, Cocoa Butter 6) By Coffee: Arabica Coffee, Robusta Coffee 7) By Cotton: Upland Cotton, Pima Cotton, Organic Cotton 8) By Spices: Black Pepper, Turmeric, Ginger, Chili Peppers, Cinnamon, Other Spices 9) By Other Products: Sugar, Palm Oil, Barley, Oats, Tea, Fruits, Vegetables The top segments in the agricultural commodity market will be: • Offline will reach $5179079.19 Million by 2025. • Business To Business will reach $5149278.53 Million by 2025. • Other Products will reach $1832660.58 Million by 2025. • Soybeans will reach $993644.24 Million by 2025. • Business To Consumer will reach $898126 Million by 2025.What Is Driver Of The Agricultural Commodity Market?
The increasing demand for healthier diets is expected to propel the growth of the agricultural commodity market going forward. Healthier diets refer to eating patterns or choices that promote physical well-being and reduce the risk of chronic diseases. The increasing demand for healthier diets is due to rising health awareness, concerns about food safety, a desire for weight management, the prevalence of chronic diseases, and accessibility to nutritious food options. Agricultural commodities are the cornerstone of healthy diets by providing critical nutrients, promoting various food choices, and improving overall health and well-being. For instance, in 2024, according to the International Food Information Council, a US-based nonprofit organization, the share of consumers seeking to increase their protein intake has steadily grown, from 59% in 2022 to 67% in 2023 and 71% in 2024. Therefore, the increasing demand for healthier diets is driving the growth of the agricultural commodity industry.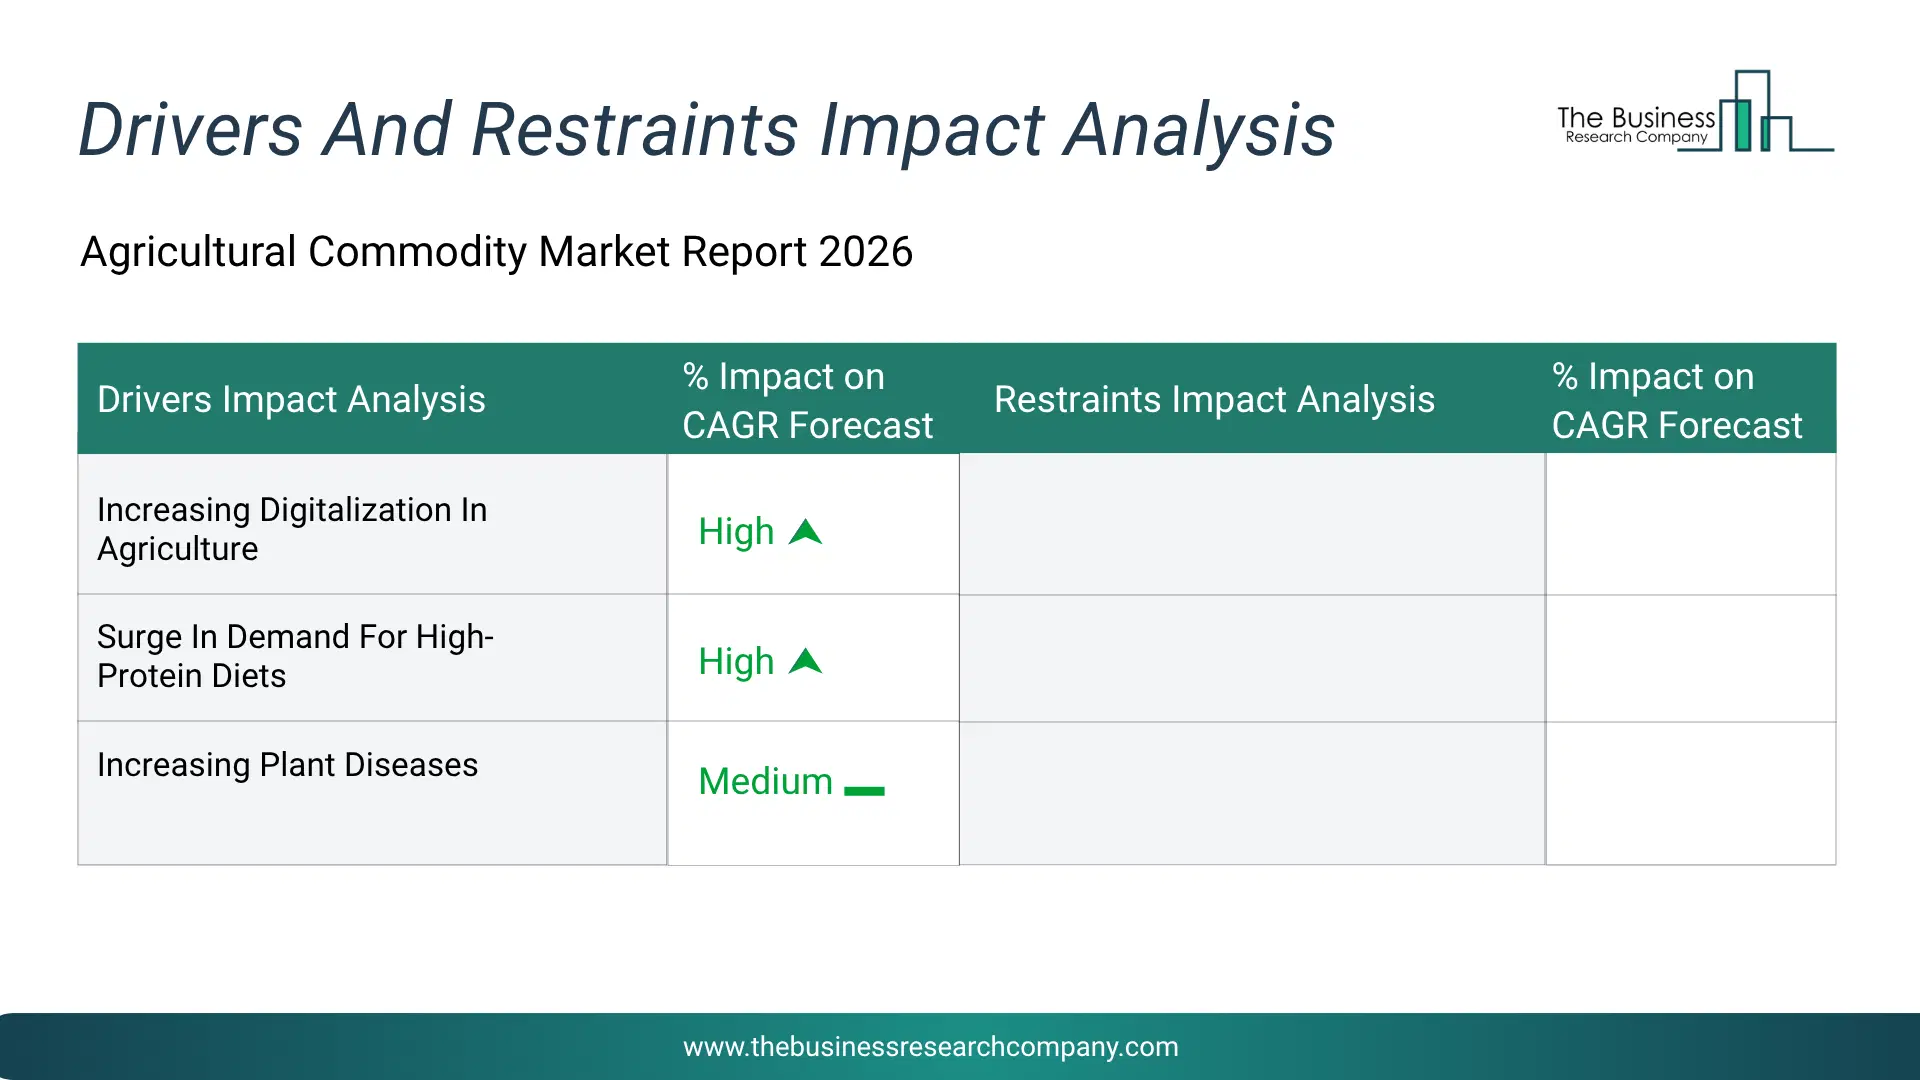
Infographic Chart Showing Key Market Drivers Analysis And Restraints For Agricultural Commodity Market
The chart presents an impact analysis of key drivers and restraints, quantifying their relative influence on the market's growth rate and helping assess the balance between growth enablers and limiting factors. This chart offers a high-level perspective; the full report contains more detailed insights.
How Will The Drivers Impact Growth In The Global Agricultural Commodity Market?
• Increasing Digitalization In Agriculture (High) – The increasing digitalization in agriculture will become a key driver of growth in the agricultural commodity market by 2030. Digitalization in agriculture enhances productivity and efficiency through precision farming, IoT-based monitoring and data-driven decision-making, leading to higher yields and better-quality agricultural commodities. Additionally, improved supply chain transparency, predictive analytics and smart marketplaces optimize distribution, reduce waste and stabilize commodity prices. As a result, increasing digitalization in agriculture is anticipated to contributing to a 1.5% annual growth in the market. • Surge In Demand For High-Protein Diets (High) – The surge in demand for high-protein diets will become a key driver of growth in the agricultural commodity market by 2030. The rising demand for high-protein diets drives increased production of protein-rich agricultural commodities such as soybeans, pulses and livestock, boosting market value and farmer incomes. This trend also encourages innovation in crop breeding, sustainable feed production and alternative protein sources, enhancing overall agricultural efficiency and resilience. As a result, surge in demand for high-protein diets is anticipated to contributing to a 3.0% annual growth in the market. • Increasing Plant Diseases (Medium) – The increasing plant diseases will serve as a key growth catalyst agricultural commodity market by 2030. The rise in plant diseases drives demand for advanced crop protection solutions, including pesticides, biocontrol agents and disease-resistant seed varieties, boosting market growth for these agricultural inputs. Additionally, it accelerates research and innovation in agritech, enhancing sustainable farming practices and ensuring a more resilient supply of key agricultural commodities. Therefore, this increasing plant diseases is projected to supporting to a 1.0% annual growth in the market. • Surge In Biofuel Production Demand (Medium) – The surge in biofuel production demand will serve as a key growth catalyst for agricultural commodity market by 2030. The growing demand for biofuel production increases the market value of key agricultural commodities like corn, sugarcane and soybeans, benefiting farmers and agribusinesses. This surge also drives innovation in sustainable farming practices and enhances rural economies by creating new opportunities in feedstock cultivation and processing industries. Therefore, this surge in biofuel production demand will is projected to supporting to a 2.5% annual growth in the market.How Will The Restraints Impact Growth In The Global Agricultural Commodity Market?
• Supply Chain Disruptions (High) – Supply Chain Disruptions will restrict the growth of the Agricultural Commodity market during the forecast period. Agricultural commodity supply chains are vulnerable to disruptions from climate events, geopolitical tensions, trade restrictions, and logistics challenges. Supply chain interruptions affect commodity availability, price stability, and food security. Disruptions can lead to price volatility, reduced trade volumes, and uncertainty in agricultural markets, impacting market growth and stability. • Climate Change (High) – Climate Change will restrict the growth of the Agricultural Commodity market during the forecast period. Climate change affects agricultural productivity through changing weather patterns, increased frequency of extreme events, and shifting growing zones. Crop yields and quality are impacted by temperature changes, water availability, and pest pressures. Climate variability creates production uncertainty and affects supply stability, impacting agricultural commodity markets and trade patterns.Key Players In The Global Agricultural Commodity Market
Major companies operating in the agricultural commodity market are Glencore plc, Cargill Inc., Archer Daniels Midland Company, Bunge Limited, Louis Dreyfus Company B.V., Smithfield Foods Inc., Wilmar International Limited, Fresh Del Monte Produce Inc., Olam International Limited, Adecoagro S.A., BrasilAgro, Devex S.A., CHS Inc., COFCO International, Nidera B.V., Richardson International Ltd., Viterra Ltd., Gunvor Group, Sucafina S.A., Ecom Agroindustrial Corp., Oetker Group, Barry Callebaut, Grupo Bimbo, Marubeni Corporation, Itochu Corporation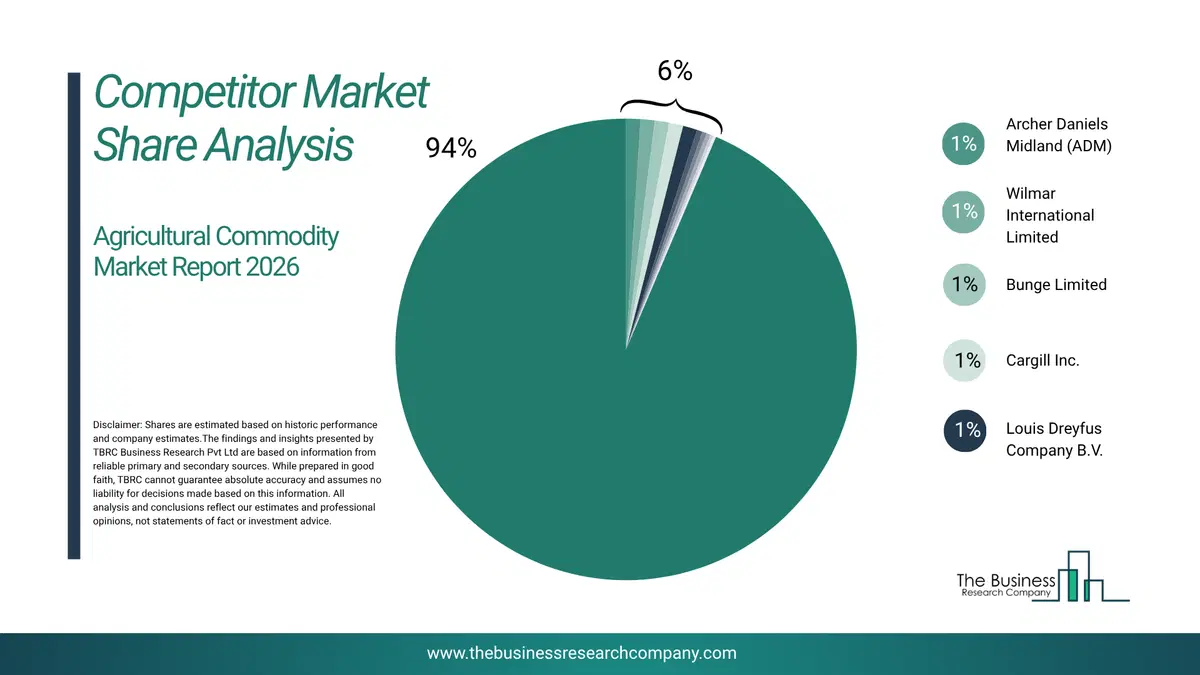
This chart is for illustrative purposes; the full report includes a detailed competitor analysis and comprehensive overview of the top 10 companies in the market.
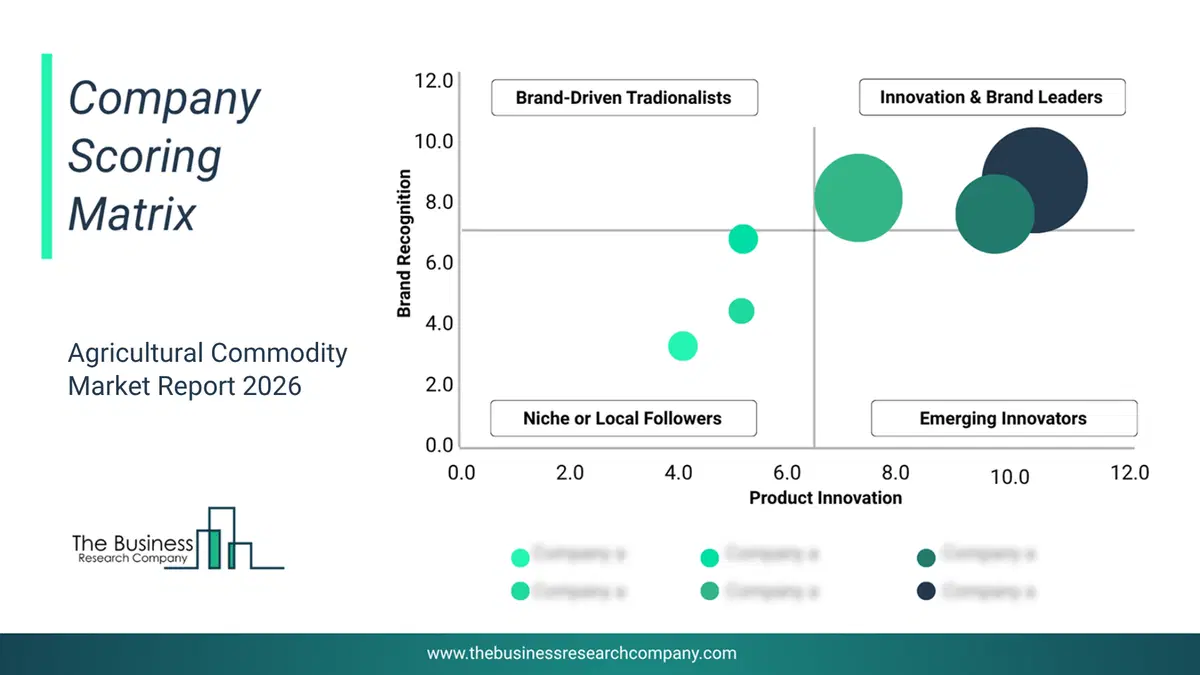
This chart maps companies by product innovation and brand strength, with bubble size indicating relative revenue, helping identify market leaders, challengers, and niche players. This is an illustrative chart; the full report provides a complete and accurate competitive analysis.
Global Agricultural Commodity Market Trends and Insights
Major companies operating in the agricultural commodities market are focusing on innovative solutions, such as high-yield or protein-content soy seed varieties to enhance crop yield and resilience. High-yield soy seed varieties refer to those that produce a greater quantity of soybeans per acre, while high protein content varieties have a higher percentage of protein in the harvested beans, enhancing their nutritional value and market appeal. For instance, in Mach 2024, Protealis, a Belgium-based seeds and seed technologies developer for sustainable plant proteins, launched PRO Vesuvio, PRO Helicon, PRO Taranaki, and PRO Jacinto in Europe, with a focus on the colder climates of Northern Europe. This strategic initiative aims to boost local protein production and offer sustainable alternatives for farmers transitioning away from traditional crops. These varieties are specifically bred to perform well in shorter growing seasons and colder conditions, making them ideal for regions such as Belgium, France, and Germany. They are designed to deliver both high yield and high protein content, essential for European farmers seeking to adopt more sustainable practices in their crop rotations.What Are Latest Mergers And Acquisitions In The Agricultural Commodity Market? Rovensa Group Enhances U.S. Growth Strategy With Agro-K Acquisition
In December 2023, Rovensa Group, a Portugal-based company specializing in agricultural technology and crop protection solutions, acquired Agro-K Corporation for an undisclosed amount. With this acquisition, Rovensa aims to strengthen its presence in the biostimulant market, enhance its product portfolio, and expand its footprint in the United States agricultural sector. Agro-K Corporation is a US-based company specializing in organic and sustainable agricultural inputs and solutions.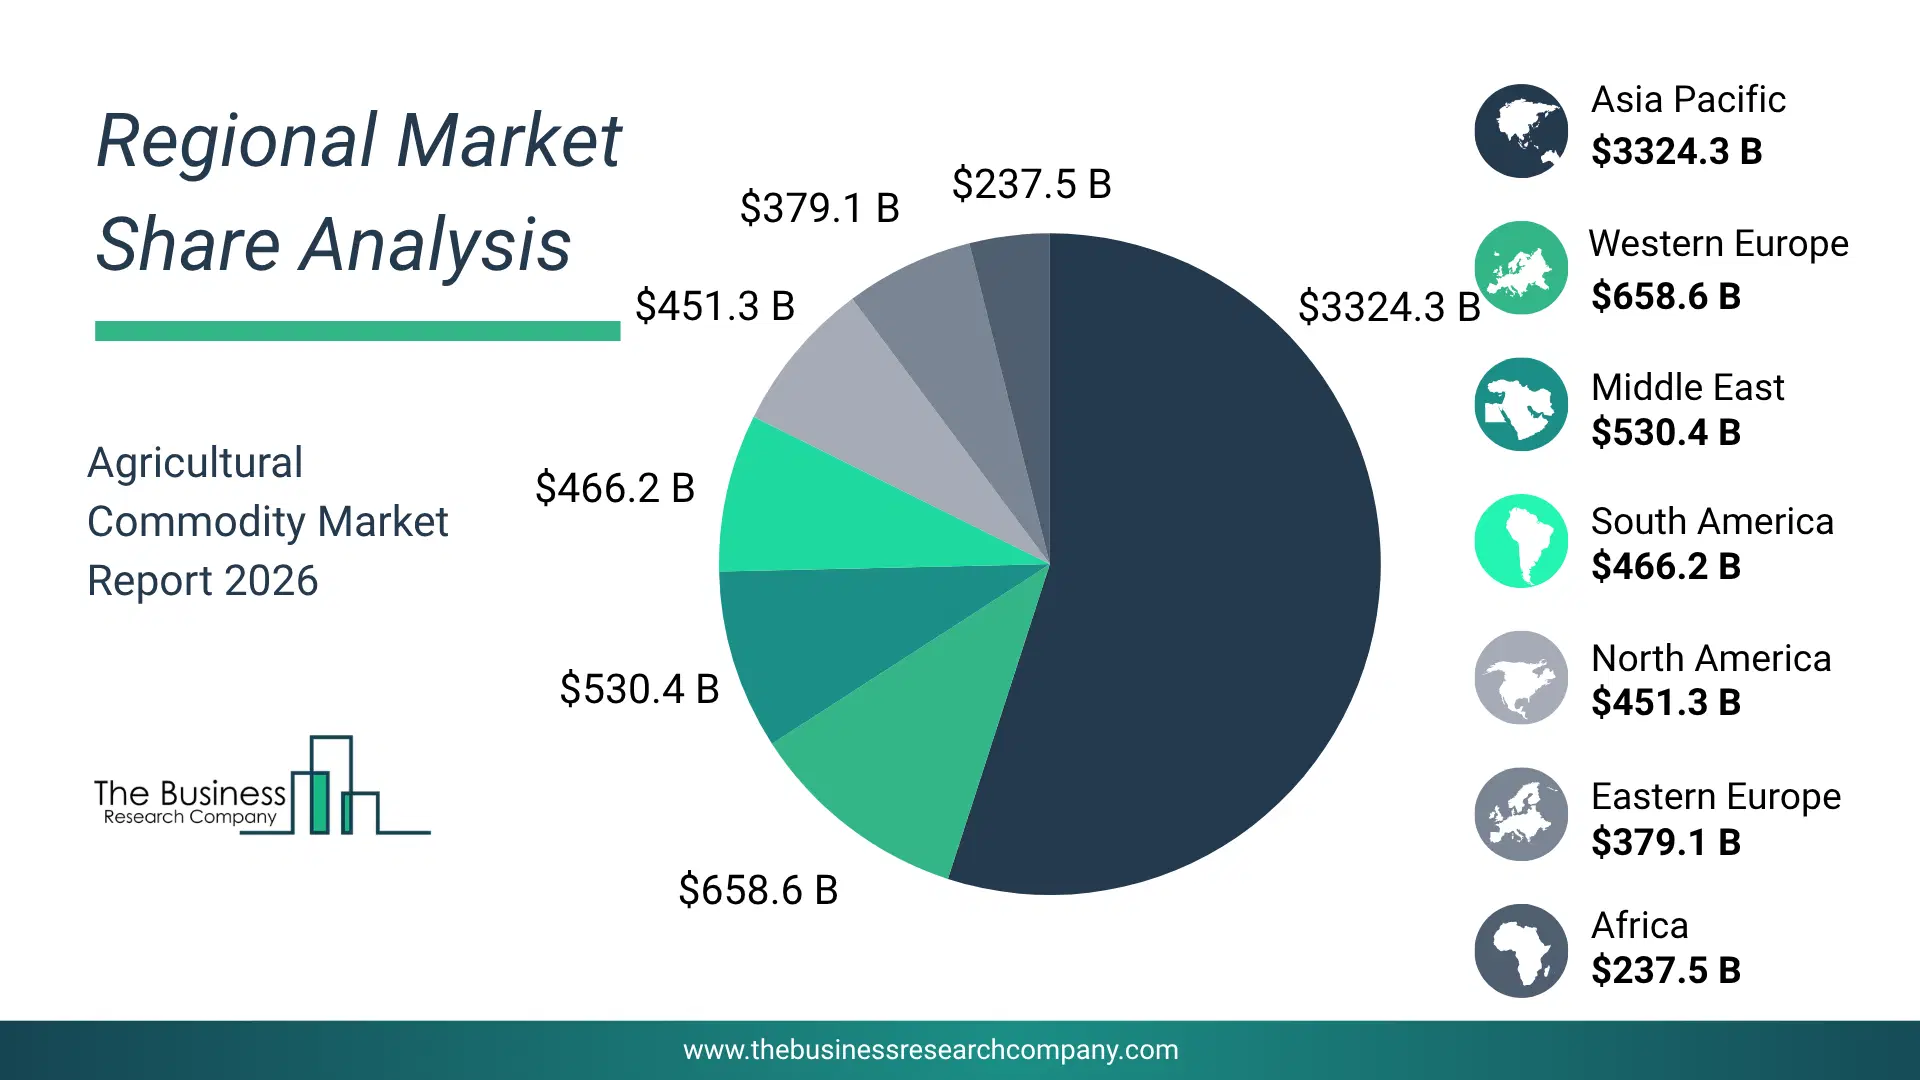
Regional Outlook
North America was the largest region in the agricultural commodity market in 2025. The regions covered in this market report are Asia-Pacific, South East Asia, Western Europe, Eastern Europe, North America, South America, Middle East, Africa. The countries covered in this market report are Australia, Brazil, China, France, Germany, India, Indonesia, Japan, Taiwan, Russia, South Korea, UK, USA, Canada, Italy, SpainWhat Defines the Agricultural Commodity Market?
The agricultural commodity market consists of sales of livestock and animal products, fruits, vegetables, oilseeds, nuts, and fibers. Values in this market are ‘factory gate’ values, that is the value of goods sold by the manufacturers or creators of the goods, whether to other entities (including downstream manufacturers, wholesalers, distributors and retailers) or directly to end customers. The value of goods in this market includes related services sold by the creators of the goods.How is Market Value Defined and Measured?
The market value is defined as the revenues that enterprises gain from the sale of goods and/or services within the specified market and geography through sales, grants, or donations in terms of the currency (in USD unless otherwise specified). The revenues for a specified geography are consumption values that are revenues generated by organizations in the specified geography within the market, irrespective of where they are produced. It does not include revenues from resales along the supply chain, either further along the supply chain or as part of other products.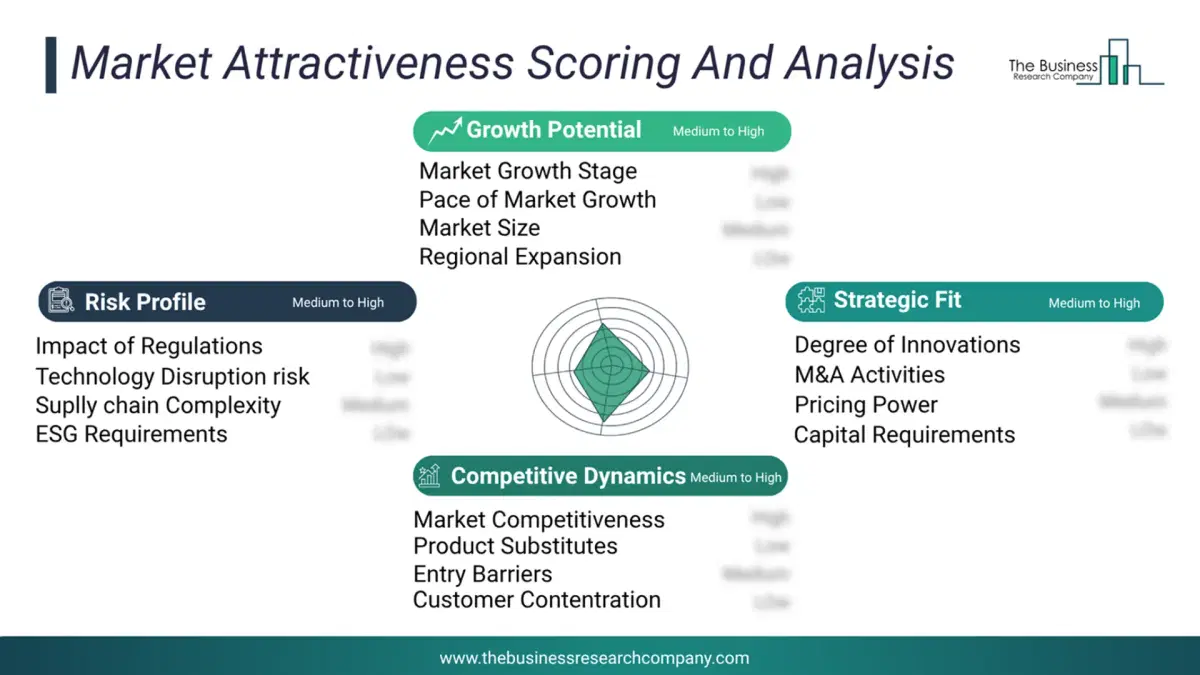
This chart presents market attractiveness based on a quantitative evaluation of growth, competition, strategic alignment, and risk, offering a clear view of opportunity areas for decision-making. This chart is for illustrative purposes; the full report contains the complete analysis.
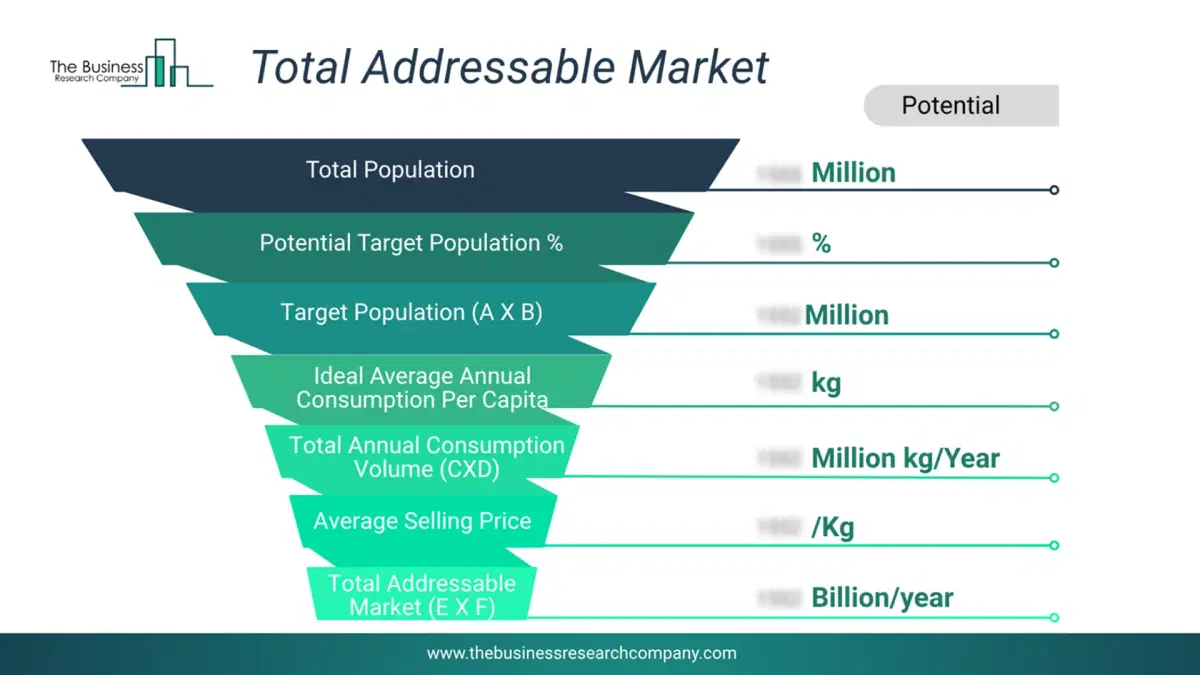
This chart highlights the Total Addressable Market (TAM) by estimating the maximum revenue opportunity using an assumption-driven approach, supporting strategic planning and opportunity sizing across markets. The chart is illustrative; the full report provides a more comprehensive analysis.
What Key Data and Analysis Are Included in the Agricultural Commodity Market Report 2026?
The agricultural commodity market research report is one of a series of new reports from The Business Research Company that provides market statistics, including industry global market size, regional shares, competitors with the market share, detailed market segments, market trends and opportunities, and any further data you may need to thrive in the agricultural commodity industry. The market research report delivers a complete perspective of everything you need, with an in-depth analysis of the current and future state of the industry.Agricultural Commodity Market Report Forecast Analysis
| Report Attribute | Details |
|---|---|
| Market Size Value In 2026 | $6519.63 billion |
| Revenue Forecast In 2030 | $5.72 billion |
| Growth Rate | CAGR of 7.4% from 2026 to 2030 |
| Base Year For Estimation | 2025 |
| Actual Estimates/Historical Data | 2020-2025 |
| Forecast Period | 2026 - 2030 |
| Market Representation | Revenue in USD Billion and CAGR from 2026 to 2030 |
| Segments Covered | Product, Trading, End User |
| Regional Scope | Asia-Pacific, Western Europe, Eastern Europe, North America, South America, Middle East, Africa |
| Country Scope | The countries covered in the report are Australia, Brazil, China, France, Germany, India, Indonesia, Japan, Taiwan, Russia, South Korea, UK, USA, Canada, Italy, Spain. |
| Key Companies Profiled | Glencore plc, Cargill Inc., Archer Daniels Midland Company, Bunge Limited, Louis Dreyfus Company B.V., Smithfield Foods Inc., Wilmar International Limited, Fresh Del Monte Produce Inc., Olam International Limited, Adecoagro S.A., BrasilAgro, Devex S.A., CHS Inc., COFCO International, Nidera B.V., Richardson International Ltd., Viterra Ltd., Gunvor Group, Sucafina S.A., Ecom Agroindustrial Corp., Oetker Group, Barry Callebaut, Grupo Bimbo, Marubeni Corporation, Itochu Corporation |
| Customization Scope | Request for Customization |
| Pricing And Purchase Options | Explore Purchase Options |