

Airline Route Profitability Analytics Market Report 2026
Global Outlook – By Component (Software, Services), By Deployment Mode (On Premises, Cloud), By Application (Network Planning, Revenue Management, Cost Analysis, Performance Benchmarking, Other Applications), By End User (Commercial Airlines, Cargo Airlines, Regional Airlines, Other End Users) – Market Size, Trends, Strategies, and Forecast to 2030
Airline Route Profitability Analytics Market Overview
• Airline Route Profitability Analytics market size has reached to $1.36 billion in 2025 • Expected to grow to $2.4 billion in 2030 at a compound annual growth rate (CAGR) of 12% • Growth Driver: Rising Fuel Price Volatility Driving The Market Growth Due To Increasing Energy Price Fluctuations • Market Trend: Technological Advancements In Data-Driven Financial Modeling For Airline Route Optimization • North America was the largest region in 2025 and Asia-Pacific is the fastest growing region.What Is Covered Under Airline Route Profitability Analytics Market?
Airline route profitability analytics refers to the use of advanced analytical tools and software systems to evaluate, monitor, and optimize the financial performance of airline flight routes. It leverages data such as passenger demand, fuel costs, load factors, pricing, competition, and operational efficiency to support decision-making in route planning and network optimization. It helps airlines identify profitable routes, reduce operational inefficiencies, and improve overall revenue management. The main components of airline route profitability analytics include software and services. Software refers to analytical platforms used to evaluate route performance, optimize pricing strategies, and improve airline network efficiency using data-driven insights. These solutions are deployed through on premises and cloud models. The various applications involved are network planning, revenue management, cost analysis, performance benchmarking, and others, and they are used by several end users such as commercial airlines, cargo airlines, regional airlines, and others.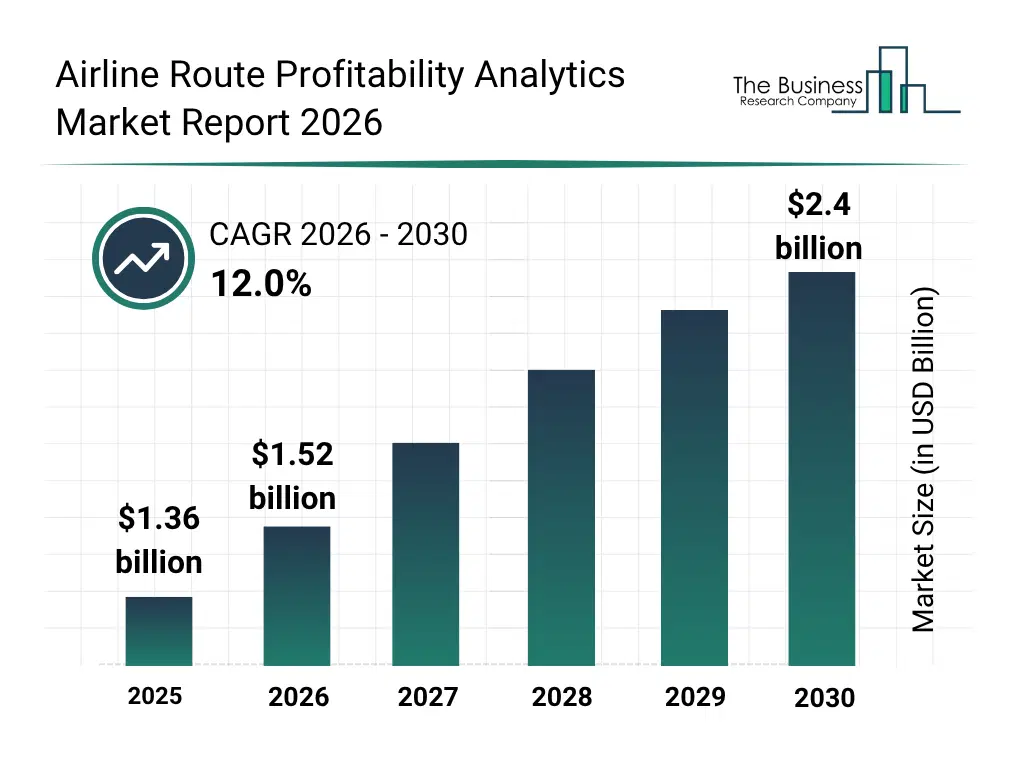
What Is The Airline Route Profitability Analytics Market Size and Share 2026?
The airline route profitability analytics market size has grown rapidly in recent years. It will grow from $1.36 billion in 2025 to $1.52 billion in 2026 at a compound annual growth rate (CAGR) of 12.4%. The growth in the historic period can be attributed to growth in global air passenger traffic, increasing fuel price volatility, expansion of low cost carrier networks, rising competition among airlines, adoption of basic revenue management systems.What Is The Airline Route Profitability Analytics Market Growth Forecast?
The airline route profitability analytics market size is expected to see rapid growth in the next few years. It will grow to $2.4 billion in 2030 at a compound annual growth rate (CAGR) of 12.0%. The growth in the forecast period can be attributed to increasing adoption of AI based aviation analytics platforms, growing demand for fuel efficient route optimization, expansion of real time data driven decision systems, rising focus on airline profitability maximization, increasing integration of cloud based airline operations platforms. Major trends in the forecast period include AI driven route profitability optimization and forecasting models, dynamic pricing integration with real time demand analytics, adoption of predictive fuel cost and operational efficiency modeling, expansion of network wide revenue management optimization platforms, increasing use of cloud based airline decision intelligence systems.
Global Airline Route Profitability Analytics Market Segmentation
1) By Component: Software; Services 2) By Deployment Mode: On Premises; Cloud 3) By Application: Network Planning; Revenue Management; Cost Analysis; Performance Benchmarking; Other Applications 4) By End User: Commercial Airlines; Cargo Airlines; Regional Airlines; Other End Users Subsegments: 1) By Software: Route Profitability Analysis Software; Revenue Management Analytics Software; Demand Forecasting And Optimization Software; Pricing And Yield Management Software; Dashboard And Reporting Software 2) By Services: Implementation And Integration Services; Consulting And Advisory Services; Data Analytics And Modeling Services; Maintenance And Support Services; Training And Enablement ServicesWhat Is The Driver Of The Airline Route Profitability Analytics Market?
The rising fuel price volatility is expected to propel the growth of the airline route profitability analytics market going forward. Fuel price volatility refers to fluctuations in aviation fuel and petroleum prices caused by changes in crude oil markets. Fuel price volatility is increasing due to fluctuations in global crude oil supply and demand, which leads to frequent changes in oil prices that directly affect fuel costs worldwide. Airline route profitability analytics help manage fuel price volatility by optimizing route planning, pricing strategies, and fuel consumption in response to fluctuating crude oil costs, ensuring airlines maintain profitability and operational efficiency. For instance, in September 2025, according to Heycar, a UK-based software development company, overall, fuel prices are still below the peak levels reached in 2022 and early 2023, but they have started to fluctuate more again in 2026. Therefore, the rising fuel price volatility is driving the growth of the airline route profitability analytics industry.Key Players In The Global Airline Route Profitability Analytics Market
Major companies operating in the airline route profitability analytics market are Google LLC; Microsoft Corporation; The Boeing Company; International Business Machines Corporation; Oracle Corporation; Lufthansa Systems GmbH & Co. KG; SAP SE; Tata Consultancy Services Limited; Infosys Limited; DXC Technology Company; Wipro Limited; Amadeus IT Group S.A.; Fraport AG Frankfurt Airport Services Worldwide; Sabre Corporation; PROS Holdings Inc.; Intelisys Aviation Systems; Ramco Systems Limited; Hitit Bilgisayar Hizmetleri A.Ş.Global Airline Route Profitability Analytics Market Trends and Insights
Major companies operating in the airline route profitability analytics market are focusing on developing innovative solutions, such as integrated route financial simulation modules to enhance airline decision-making accuracy, optimize route performance, and improve revenue forecasting. Integrated route financial simulation modules are aviation analytics tools that combine demand, costs, and pricing data to simulate route profitability under different scenarios, helping airlines and airports assess viability, optimize routes, and improve revenue and network efficiency. For instance, in October 2025, FlightBI, a US-based aviation analytics company, introduced a new Airport Cost Module within its Fligence Planning platform to enhance route profitability evaluation for airports and airlines. The module enables users to define and compare airport-specific costs such as landing fees, take-off charges, and per-passenger costs to reflect true operational expenses across competing airports. It integrates with demand forecasting and financial modeling systems to simulate route performance under different fee and incentive scenarios, helping airports demonstrate cost competitiveness and strengthen airline business cases.What Are Latest Mergers And Acquisitions In The Airline Route Profitability Analytics Market?
In July 2024, Portside Inc., a US-based aviation technology company, acquired Takeflite Limited for an undisclosed amount. With this acquisition, Portside, Inc. aimed to expand its integrated aviation software ecosystem by adding end-to-end airline operations, cargo, and charter management capabilities, thereby strengthening its ability to serve both commercial and business aviation operators with a unified cloud-based platform. Takeflite Limited is a New Zealand-based aviation software company that specializes in providing airline route profitability analytics.Regional Outlook
North America was the largest region in the airline route profitability analytics market in 2025. Asia-Pacific is expected to be the fastest-growing region in the forecast period. The regions covered in this market report are Asia-Pacific, South East Asia, Western Europe, Eastern Europe, North America, South America, Middle East, Africa. The countries covered in this market report are Australia, Brazil, China, France, Germany, India, Indonesia, Japan, Taiwan, Russia, South Korea, UK, USA, Canada, Italy, Spain.What Defines the Airline Route Profitability Analytics Market?
The airline route profitability analytics market includes revenues earned by entities by providing services such as analytics software platforms, route optimization tools, predictive modeling, data integration and management, real-time performance monitoring, consulting and advisory services, cloud-based analytics deployment, and maintenance and support services. The market value includes the value of related goods sold by the service provider or included within the service offering. Only goods and services traded between entities or sold to end consumers are included.How is Market Value Defined and Measured?
The market value is defined as the revenues that enterprises gain from the sale of goods and/or services within the specified market and geography through sales, grants, or donations in terms of the currency (in USD unless otherwise specified). The revenues for a specified geography are consumption values that are revenues generated by organizations in the specified geography within the market, irrespective of where they are produced. It does not include revenues from resales along the supply chain, either further along the supply chain or as part of other products.What Key Data and Analysis Are Included in the Airline Route Profitability Analytics Market Report 2026?
The airline route profitability analytics market research report is one of a series of new reports from The Business Research Company that provides market statistics, including industry global market size, regional shares, competitors with the market share, detailed market segments, market trends and opportunities, and any further data you may need to thrive in the airline route profitability analytics industry. The market research report delivers a complete perspective of everything you need, with an in-depth analysis of the current and future state of the industry.Airline Route Profitability Analytics Market Report Forecast Analysis
| Report Attribute | Details |
|---|---|
| Market Size Value In 2026 | $1.52 billion |
| Revenue Forecast In 2030 | $2.4 billion |
| Growth Rate | CAGR of 12% from 2026 to 2030 |
| Base Year For Estimation | 2025 |
| Actual Estimates/Historical Data | 2020-2025 |
| Forecast Period | 2026 - 2030 |
| Market Representation | Revenue in USD Billion and CAGR from 2026 to 2030 |
| Segments Covered | Component, Deployment Mode, Application, End User |
| Regional Scope | Asia-Pacific, Western Europe, Eastern Europe, North America, South America, Middle East, Africa |
| Country Scope | The countries covered in the report are Australia, Brazil, China, France, Germany, India, ... |
| Key Companies Profiled | Google LLC; Microsoft Corporation; The Boeing Company; International Business Machines Corporation; Oracle Corporation; Lufthansa Systems GmbH & Co. KG; SAP SE; Tata Consultancy Services Limited; Infosys Limited; DXC Technology Company; Wipro Limited; Amadeus IT Group S.A.; Fraport AG Frankfurt Airport Services Worldwide; Sabre Corporation; PROS Holdings Inc.; Intelisys Aviation Systems; Ramco Systems Limited; Hitit Bilgisayar Hizmetleri A.Ş. |
| Customization Scope | Request for Customization |
| Pricing And Purchase Options | Explore Purchase Options |