
Aqua Ammonia Market Report 2026
Global Outlook – By Type (Industrial Grade Aqua Ammonia, Technical Grade Aqua Ammonia, Electronic Grade Aqua Ammonia, Pharmaceutical Grade Aqua Ammonia, Food Grade Aqua Ammonia), By Concentration (Low Concentration, Medium Concentration, High Concentration), By Distribution Channel (Direct Sales, Distributors And Wholesalers, Bulk Supply Contracts), By End Use (Water And Wastewater Treatment, Agriculture, Chemicals, Food And Beverage, Pharmaceuticals, Other End Uses) – Market Size, Trends, Strategies, and Forecast to 2030
Aqua Ammonia Market Overview
• Aqua Ammonia market size has reached to $2.49 billion in 2025 • Expected to grow to $3.16 billion in 2030 at a compound annual growth rate (CAGR) of 4.9% • Growth Driver: Growth In Water And Wastewater Treatment Infrastructure Boosting The Market Due To Rising Urbanization And Water Treatment Demand • Market Trend: Focus On High-Purity Aqueous Ammonia Innovations For Enhanced Industrial Efficiency And Compliance • North America was the largest region in 2025 and Asia-Pacific is the fastest growing region.What Is Covered Under Aqua Ammonia Market?
Aqua ammonia is a clear, colorless solution produced by dissolving ammonia gas (NH₃) in water. It acts as a weak alkaline solution due to the partial conversion of ammonia into ammonium and hydroxide ions. Its chemical properties make it widely useful in industrial processing, cleaning, and water treatment applications. The main types of aqua ammonia include industrial grade aqua ammonia, technical grade aqua ammonia, electronic grade aqua ammonia, pharmaceutical grade aqua ammonia, and food grade aqua ammonia. Industrial grade aqua ammonia refers to an aqueous ammonia solution formulated for industrial applications such as chemical processing, water treatment, and cleaning where high consumer-grade purity is not required. These products are available in low concentration, medium concentration, and high concentration formulations. They are distributed through direct sales, distributors and wholesalers, and bulk supply contracts and are utilized in end uses including water and wastewater treatment, agriculture, chemicals, food and beverage, pharmaceuticals, and others.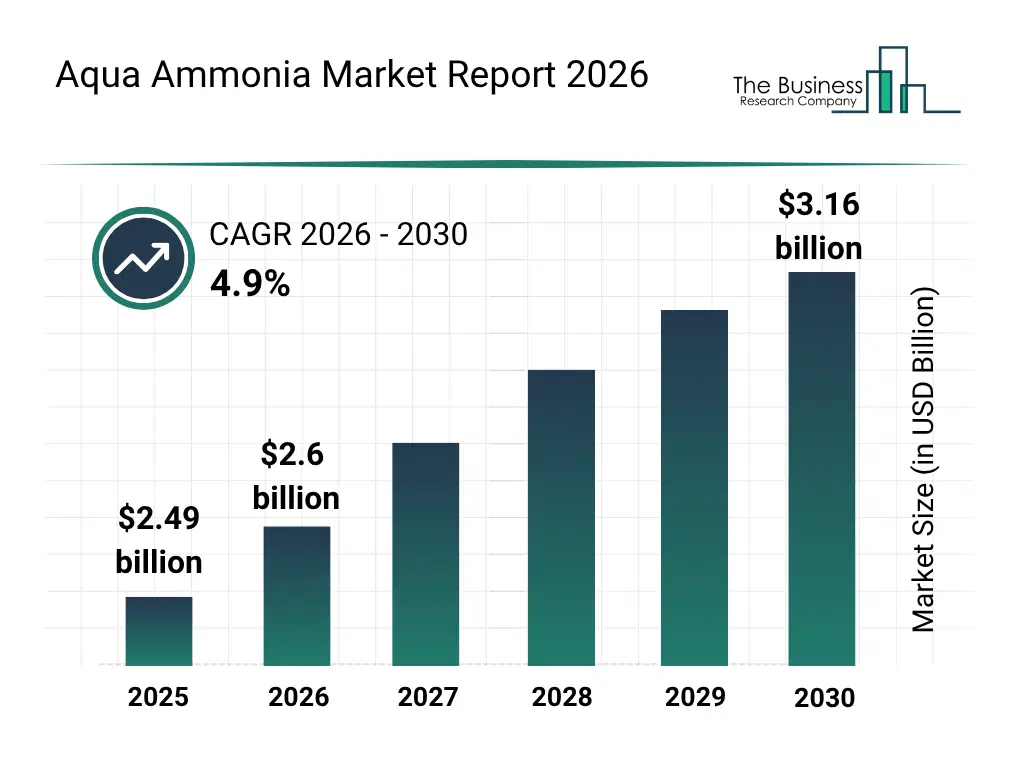
What Is The Aqua Ammonia Market Size and Share 2026?
The aqua ammonia market size has grown steadily in recent years. It will grow from $2.49 billion in 2025 to $2.6 billion in 2026 at a compound annual growth rate (CAGR) of 4.7%. The growth in the historic period can be attributed to increasing demand for industrial cleaning chemicals, growing adoption of ammonia-based water treatment solutions, rising fertilizer production activities, expanding chemical processing industries, increasing usage in laboratory and industrial applications.What Is The Aqua Ammonia Market Growth Forecast?
The aqua ammonia market size is expected to see steady growth in the next few years. It will grow to $3.16 billion in 2030 at a compound annual growth rate (CAGR) of 4.9%. The growth in the forecast period can be attributed to rising demand for high purity aqua ammonia grades, increasing wastewater treatment investments, growing semiconductor manufacturing activities, expanding pharmaceutical production capacity, increasing adoption of sustainable chemical processing solutions. Major trends in the forecast period include rising demand for high purity aqua ammonia in industrial applications, increasing adoption of aqua ammonia in wastewater treatment processes, growing use of aqua ammonia as an industrial neutralizing agent, rising consumption of aqua ammonia in semiconductor and electronics manufacturing, increasing demand for pharmaceutical and food grade aqua ammonia formulations.
Global Aqua Ammonia Market Segmentation
2) By Concentration: Low Concentration, Medium Concentration, High Concentration 3) By Distribution Channel: Direct Sales, Distributors And Wholesalers, Bulk Supply Contracts 4) By End Use: Water And Wastewater Treatment, Agriculture, Chemicals, Food And Beverage, Pharmaceuticals, Other End Uses Subsegments: 1) By Industrial Grade Aqua Ammonia: Chemical Manufacturing, Fertilizer Production, Textile Processing, Pulp And Paper Processing, Metal Treatment And Cleaning 2) By Technical Grade Aqua Ammonia: Industrial Cleaning Agents, Water Treatment Chemicals, Gas Scrubbing And Emissions Control, Laboratory Reagents For Non Critical Use 3) By Electronic Grade Aqua Ammonia: Semiconductor Fabrication, Microelectronics Cleaning, Wafer Processing, Photovoltaic Solar Cell Manufacturing 4) By Pharmaceutical Grade Aqua Ammonia: Active Pharmaceutical Ingredient Synthesis, Drug Formulation Processing, Pharmaceutical Intermediates Production, Sterile Laboratory Applications 5) By Food Grade Aqua Ammonia: Food Processing Potential Of Hydrogen Regulation, Baking And Leavening Applications Processing Aid, Food Grade Cleaning And Sanitation Systems, Beverage Processing Support Regulated UseWhat Are The Drivers Of The Aqua Ammonia Market?
The expansion of water and wastewater treatment infrastructure is expected to propel the growth of the aqua ammonia market going forward. Water and wastewater treatment infrastructure is the system of facilities and networks used to treat raw water for safe use and to process used water to remove contaminants before discharge or reuse. Water and wastewater treatment infrastructure is expanding mainly due to rapid urbanization and population growth, which increase demand for clean water and put pressure on existing systems, requiring improved capacity for safe supply and wastewater management. Aqua ammonia supports water and wastewater treatment infrastructure by helping control pH and providing a nitrogen source that enhances biological processes such as nitrification for more efficient contaminant removal. For instance, in May 2024, according to the Central Statistics Office, an Ireland-based government agency, the number of registered domestic wastewater treatment systems in Ireland grew by 1.1% to reach 492,359 in 2023. Therefore, the expansion of water and wastewater treatment infrastructure is driving the growth of the aqua-ammonia market. The rising demand from agriculture and nitrogen fertilizer production is expected to propel the growth of the aqua ammonia market going forward. Agriculture and nitrogen fertilizer production are the processes of growing crops and manufacturing nitrogen-based fertilizers that provide essential nutrients to enhance plant growth and increase agricultural productivity. Agriculture and nitrogen fertilizer production are increasing due to rising global food demand, which drives the need for higher crop yields and greater fertilizer usage to enhance agricultural output. Aqua ammonia helps agriculture and nitrogen fertilizer production by serving as a readily available nitrogen source for fertilizer manufacturing and direct agricultural applications, improving soil fertility and supporting higher crop yields. For instance, in July 2025, according to the Food and Agriculture Organization, an Italy-based UN agency, nitrogen fertilizer use increased by 32%, reaching 112 million tonnes (Mt) in 2023. Therefore, the rising demand from agriculture and nitrogen fertilizer production is driving the growth of the aqua ammonia industry.Key Players In The Global Aqua Ammonia Market
Major companies operating in the aqua ammonia market are China Petroleum & Chemical Corporation, BASF SE, Linde plc, Yara International ASA, Sinochem Holdings Corporation Ltd., Nutrien Ltd., CF Industries Holdings Inc., EuroChem Group AG, Koch Industries Inc., Air Liquide S.A., SABIC, Uralchem Joint Stock Company, Sumitomo Chemical Company Limited, Indian Farmers Fertiliser Cooperative Limited, Shandong Hualu-Hengsheng Chemical Co. Ltd., PVS Chemicals Inc., Hawkins Inc., Hydrite Chemical Co., Qatar Fertiliser Company P.S.C., LSB Industries Inc., Tanner Industries Inc., MGC Pure Chemicals America Inc., Joint Stock Company Azot
This chart is for illustrative purposes; the full report includes a detailed competitor analysis and comprehensive overview of the top 10 companies in the market.
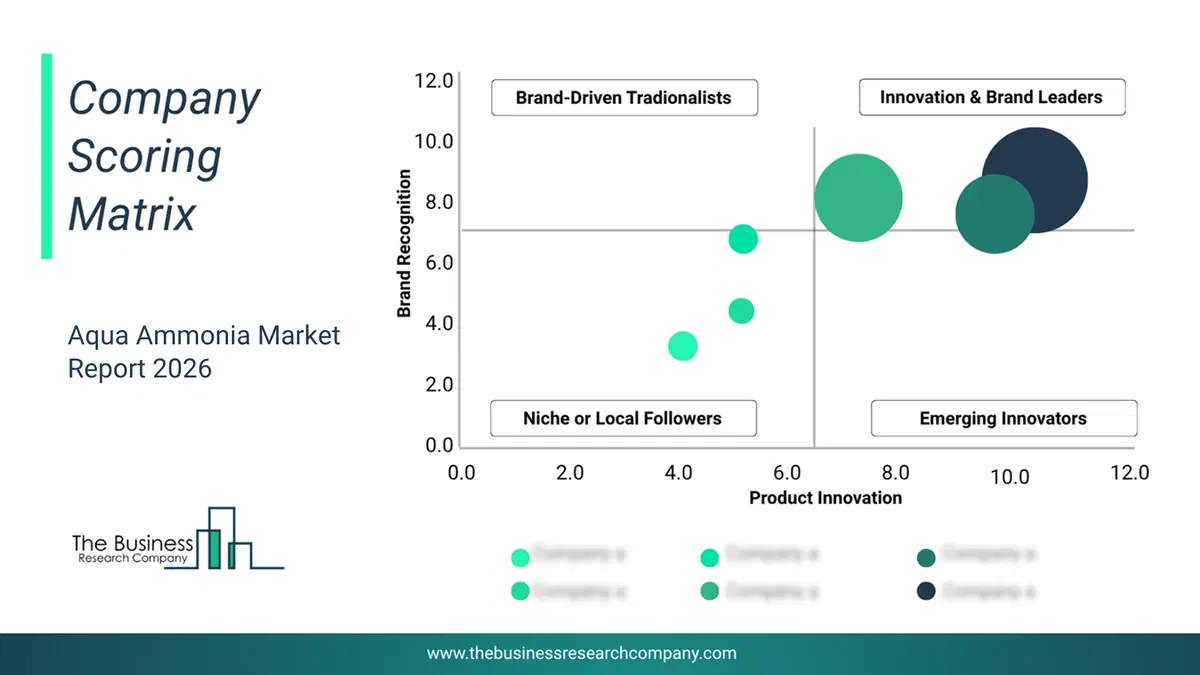
This chart maps companies by product innovation and brand strength, with bubble size indicating relative revenue, helping identify market leaders, challengers, and niche players. This is an illustrative chart; the full report provides a complete and accurate competitive analysis.
Global Aqua Ammonia Market Trends and Insights
Major companies operating in the aqua ammonia market are focusing on developing innovative solutions, such as high-purity aqueous ammonia solution, to enhance process efficiency, improve product consistency, and meet increasingly stringent industrial and environmental quality standards. High-purity aqueous ammonia solution is a highly refined ammonia-in-water solution with minimal impurities, used in applications that require strict quality control and consistent chemical performance. For instance, in July 2025, Blended Products, a UK-based chemical company, launched Aquamonia 245, a high-purity, 24.5% aqueous ammonia solution (ammonium hydroxide) for industrial use. It is designed to deliver improved handling precision and stable chemical reactivity across sensitive manufacturing processes. It also aims to support end-users in achieving tighter compliance with quality specifications while reducing variability in downstream applications.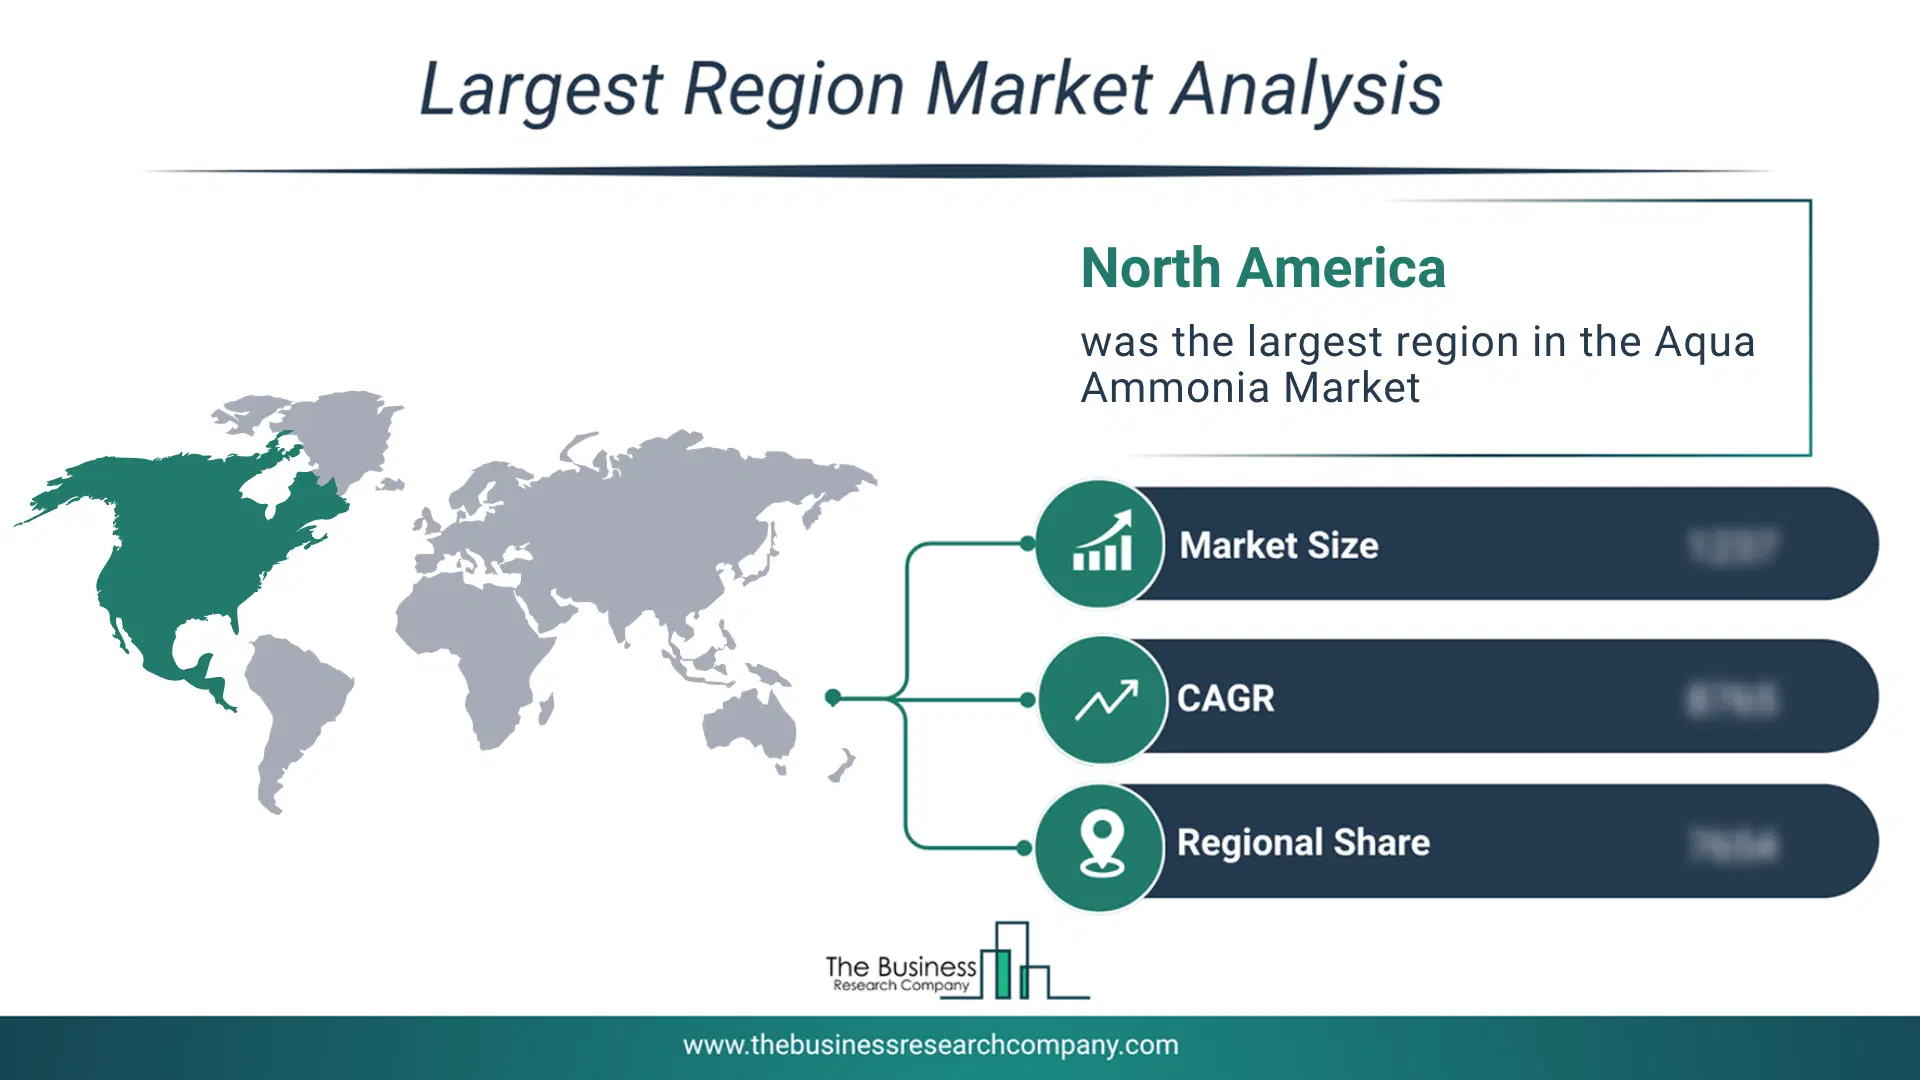
Regional Outlook/Insights
North America was the largest region in the aqua ammonia market in 2025. Asia-Pacific is expected to be the fastest-growing region in the forecast period. The regions covered in this market report are Asia-Pacific, South East Asia, Western Europe, Eastern Europe, North America, South America, Middle East, Africa. The countries covered in this market report are Australia, Brazil, China, France, Germany, India, Indonesia, Japan, Taiwan, Russia, South Korea, UK, USA, Canada, Italy, Spain.What Defines the Aqua Ammonia Market?
The aqua ammonia market consists of sales of diluted ammonia solution, concentrated ammonia solution, and anhydrous ammonia solution blends. Values in this market are ‘factory gate’ values, that is, the value of goods sold by the manufacturers or creators of the goods, whether to other entities (including downstream manufacturers, wholesalers, distributors, and retailers) or directly to end customers. The value of goods in this market includes related services sold by the creators of the goods.How is Market Value Defined and Measured?
The market value is defined as the revenues that enterprises gain from the sale of goods and/or services within the specified market and geography through sales, grants, or donations in terms of the currency (in USD unless otherwise specified). The revenues for a specified geography are consumption values that are revenues generated by organizations in the specified geography within the market, irrespective of where they are produced. It does not include revenues from resales along the supply chain, either further along the supply chain or as part of other products.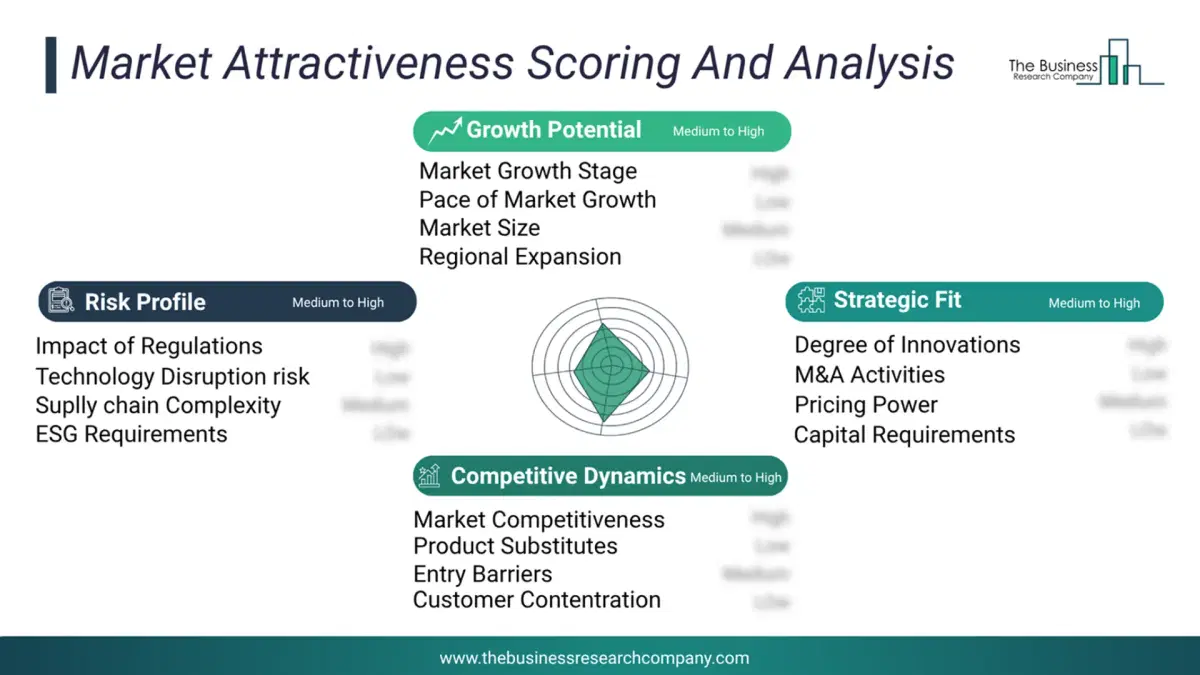
This chart presents market attractiveness based on a quantitative evaluation of growth, competition, strategic alignment, and risk, offering a clear view of opportunity areas for decision-making. This chart is for illustrative purposes; the full report contains the complete analysis.
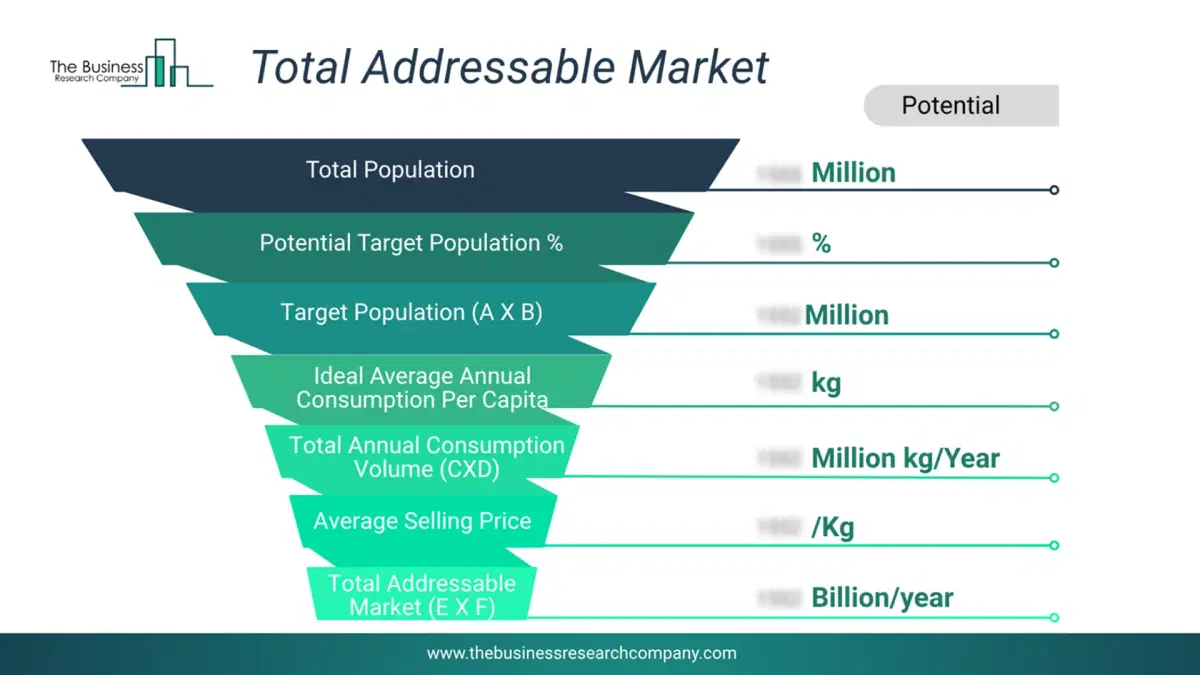
This chart highlights the Total Addressable Market (TAM) by estimating the maximum revenue opportunity using an assumption-driven approach, supporting strategic planning and opportunity sizing across markets. The chart is illustrative; the full report provides a more comprehensive analysis.
What Key Data and Analysis Are Included in the Aqua Ammonia Market Report 2026?
The aqua ammonia market research report is one of a series of new reports from The Business Research Company that provides aqua ammonia market statistics, including aqua ammonia industry global market size, regional shares, competitors with a aqua ammonia market share, detailed aqua ammonia market segments, market trends and opportunities, and any further data you may need to thrive in the aqua ammonia industry. This aqua ammonia market research report delivers a complete perspective of everything you need, with an in-depth analysis of the current and future scenario of the industry.Aqua Ammonia Market Report Forecast Analysis
| Report Attribute | Details |
|---|---|
| Market Size Value In 2026 | $2.6 billion |
| Revenue Forecast In 2030 | $3.16 billion |
| Growth Rate | CAGR of 4.9% from 2026 to 2030 |
| Base Year For Estimation | 2025 |
| Actual Estimates/Historical Data | 2020-2025 |
| Forecast Period | 2026 - 2030 |
| Market Representation | Revenue in USD Billion and CAGR from 2026 to 2030 |
| Segments Covered | Type, Concentration, Distribution Channel, End Use |
| Regional Scope | Asia-Pacific, Western Europe, Eastern Europe, North America, South America, Middle East, Africa |
| Country Scope | The countries covered in the report are Australia, Brazil, China, France, Germany, India, Indonesia, Japan, Taiwan, Russia, South Korea, UK, USA, Canada, Italy, Spain. |
| Key Companies Profiled | China Petroleum & Chemical Corporation, BASF SE, Linde plc, Yara International ASA, Sinochem Holdings Corporation Ltd., Nutrien Ltd., CF Industries Holdings Inc., EuroChem Group AG, Koch Industries Inc., Air Liquide S.A., SABIC, Uralchem Joint Stock Company, Sumitomo Chemical Company Limited, Indian Farmers Fertiliser Cooperative Limited, Shandong Hualu-Hengsheng Chemical Co. Ltd., PVS Chemicals Inc., Hawkins Inc., Hydrite Chemical Co., Qatar Fertiliser Company P.S.C., LSB Industries Inc., Tanner Industries Inc., MGC Pure Chemicals America Inc., Joint Stock Company Azot |
| Customization Scope | Request for Customization |
| Pricing And Purchase Options | Explore Purchase Options |