

Diagramming Software Market Report 2026
Global Outlook – By Type (Cloud-Based, Web-Based), By Enterprise Size (Small And Medium-Size Enterprises, Large Enterprises), By Application (Educational Institutions, Corporations, Personal) – Market Size, Trends, Strategies, and Forecast to 2030
Diagramming Software Market Overview
• Diagramming Software market size has reached to $1.12 billion in 2025 • Expected to grow to $1.88 billion in 2030 at a compound annual growth rate (CAGR) of 10.5% • Growth Driver: The Diagramming Software Is Growing Due To Automation In Documentation • Market Trend: Introducing Innovative AI-Powered Diagramming Tools To Improve Collaboration And Communication • North America was the largest region in 2025.What Is Covered Under Diagramming Software Market?
Diagramming software refers to specialized tools designed to create visual representations of processes, concepts, or structures. These platforms offer users a range of templates, shapes, and customization options to streamline the creation of diagrams for various purposes. The main types of diagramming software are cloud-based and web-based. Cloud-based diagramming software refers to applications hosted online that enable users to create, edit, and share diagrams through web browsers. It is used by various enterprises, such as small and medium-sized enterprises (SMEs) and large enterprises for several applications, including educational institutions, corporates, and personal.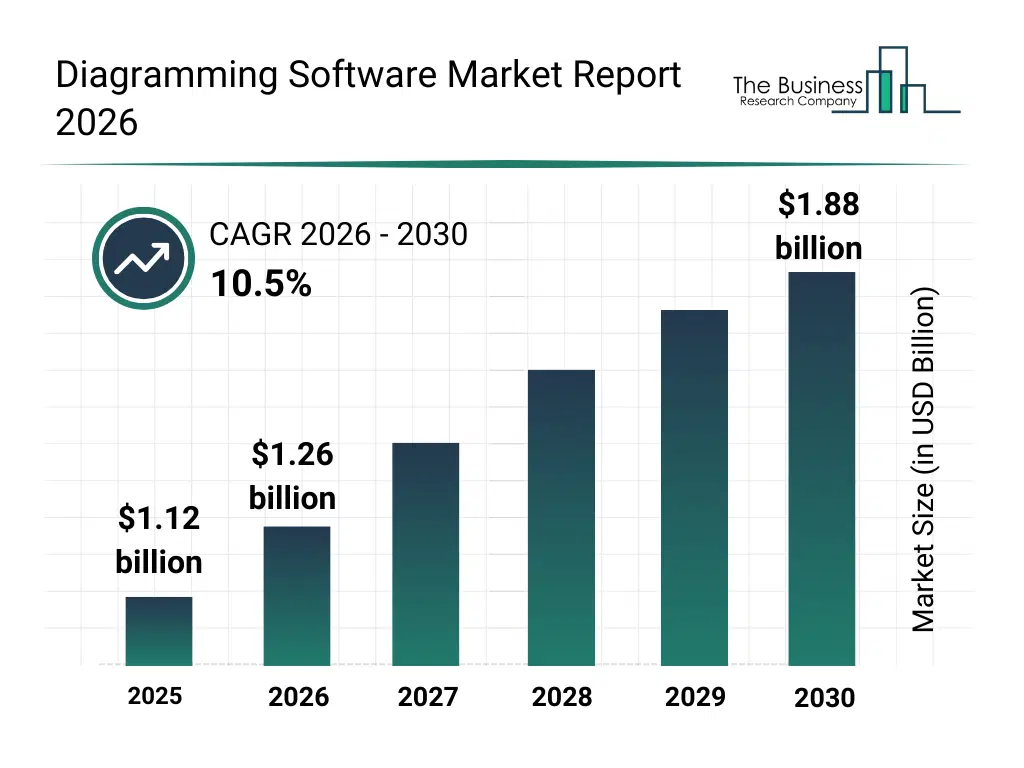
What Is The Diagramming Software Market Size and Share 2026?
The diagramming software market size has grown rapidly in recent years. It will grow from $1.12 billion in 2025 to $1.26 billion in 2026 at a compound annual growth rate (CAGR) of 12.4%. The growth in the historic period can be attributed to growth in digital workplace tools, expansion of enterprise documentation needs, increased use of visual communication methods, adoption of web-based software platforms, rising use of process mapping tools.What Is The Diagramming Software Market Growth Forecast?
The diagramming software market size is expected to see rapid growth in the next few years. It will grow to $1.88 billion in 2030 at a compound annual growth rate (CAGR) of 10.5%. The growth in the forecast period can be attributed to increasing demand for remote collaboration tools, expansion of cloud-native enterprise software, growing use of AI-assisted diagram creation, rising adoption among educational institutions, increasing focus on workflow visualization. Major trends in the forecast period include increasing adoption of cloud-based diagramming tools, rising demand for collaborative diagram creation, growing integration with productivity software suites, expansion of template-driven diagram design, enhanced focus on user-friendly interfaces.
Global Diagramming Software Market Segmentation
1) By Type: Cloud-Based, Web-Based 2) By Enterprise Size: Small And Medium-Size Enterprises, Large Enterprises 3) By Application: Educational Institutions, Corporations, Personal Subsegments: 1) By Cloud-Based: SaaS (Software As A Service), Cloud-Hosted Solutions, Hybrid Cloud Solutions 2) By Web-Based: Browser-Based Solutions, HTML5-Based Diagramming Tools, Online Collaboration PlatformsWhat Is The Driver Of The Diagramming Software Market?
The rising demand for automation in documentation is expected to propel the growth of the diagramming software market going forward. Automation in documentation refers to the process of using technology to automatically generate, manage, and update documents, reducing manual effort and improving efficiency. The rising demand for automation in documentation stems from the need to streamline document creation, management, and updates, enhancing efficiency and accuracy while reducing manual labor. Automation in documentation leverages diagramming software to visually represent processes, workflows, and data structures, enhancing clarity and comprehension. For instance, in December 2023, according to a survey by Salesforce, a US-based cloud-based software company, 47% of IT leaders claimed that the greatest ROI (return on investment) from process automation is from the operations function. Furthermore, in November 2023, the Central Digital and Data Office, a UK-based department, 32 organizations within the civil service implemented the standardized Government Digital and Data pay framework, contributing to a decrease in contractor dependency and yielding cost savings for taxpayers. Therefore, the rising demand for automation in documentation is driving the growth of the diagramming software industry.Key Players In The Global Diagramming Software Market
Major companies operating in the diagramming software market are Microsoft Corporation, Canva Pty Ltd., Miro Technologies Inc., Lucid Software Inc., Prezi Inc., Smartdraw LLC, Nulab Inc., Piktochart, Gliffy Inc., Venngage Inc., Pingboard Inc., Visio, Vizzlo GmbH, Cinergix Pty Ltd, DIA Developers India Pvt. Ltd., Slickplan, Edrawsoft, Corel Corporation, MindFusion Group, Zen Flowchart, Creately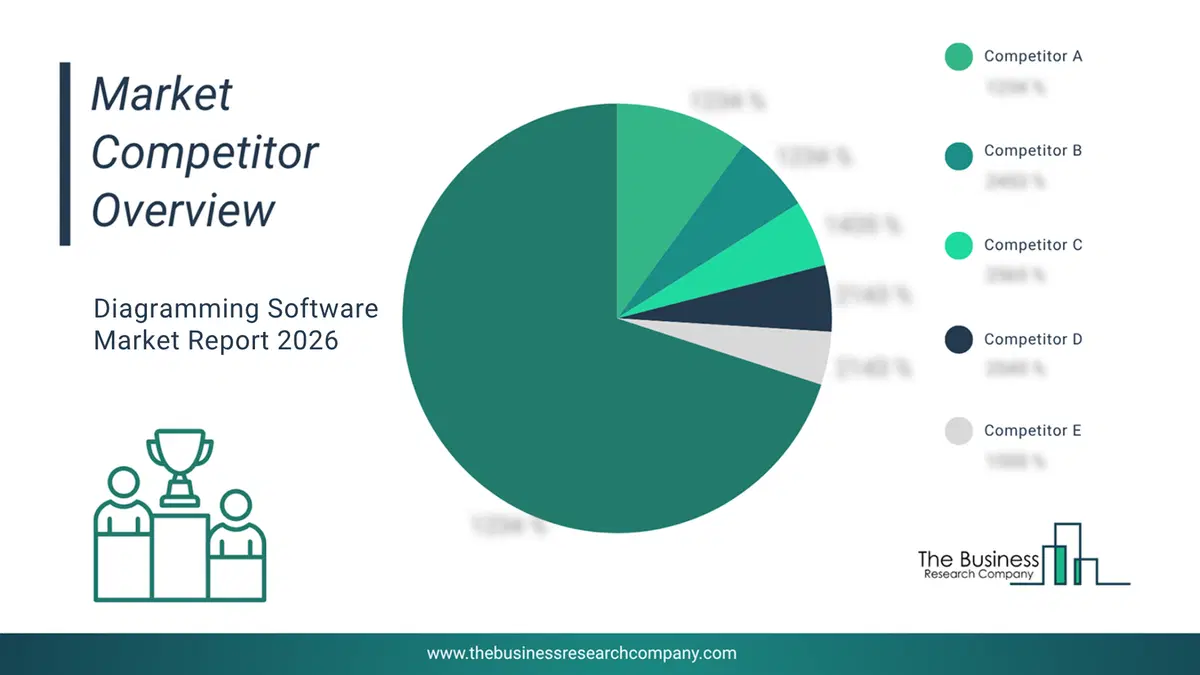
This chart is for illustrative purposes; the full report includes a detailed competitor analysis and comprehensive overview of the top 10 companies in the market.
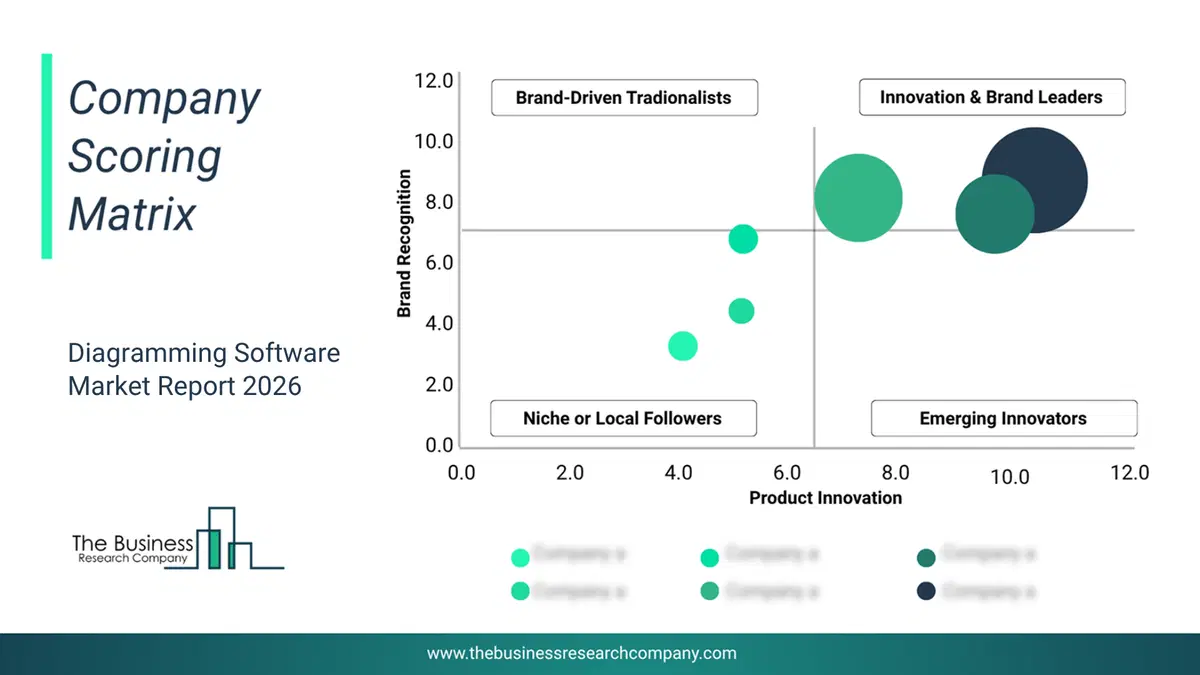
This chart maps companies by product innovation and brand strength, with bubble size indicating relative revenue, helping identify market leaders, challengers, and niche players. This is an illustrative chart; the full report provides a complete and accurate competitive analysis.
Global Diagramming Software Market Trends and Insights
Major companies operating in the diagramming software market are focusing on developing advanced solutions, such as AI-assisted diagram creation, to enhance user productivity, improve design accuracy, and streamline creative workflows. AI-assisted diagram creation refers to a technological feature in diagramming software that automatically converts user input, including text prompts and images, into professional, editable diagrams, helping users generate high-quality visuals quickly. For instance, in June 2025, Wondershare Technology Group, a China-based software company, introduced EdrawMax V14.5, a major update to its all-in-one diagramming platform. Designed to enhance creative efficiency, the solution introduces features such as AI Diagram Creator, which converts user ideas and text prompts into a range of diagram types (flowcharts, mind maps, infographics, posters, slides) with optimized layouts and harmonized color schemes; AI One-Click Replicate, which automatically analyzes input text or logic, selects appropriate templates, and generates complete diagrams in one click; and Photo-to-Diagram Converter, which transforms images captured on mobile devices, including handwritten notes, into editable diagrams, enabling mobile-first creative workflows.What Are Latest Mergers And Acquisitions In The Diagramming Software Market?
In February 2025, StructureFlow, a UK-based provider of visual modelling and diagramming software for legal, tax, and corporate professionals, acquired Blue J Diagramming for an undisclosed amount. With this acquisition, StructureFlow aimed to accelerate its expansion into tax and accounting workflows by integrating Blue J’s specialized diagram-template library and customer base. Blue J Diagramming is a Canada-based provider of diagramming software focused on accountancy and tax professionals, offering workflow-specific visualisation tools and templates.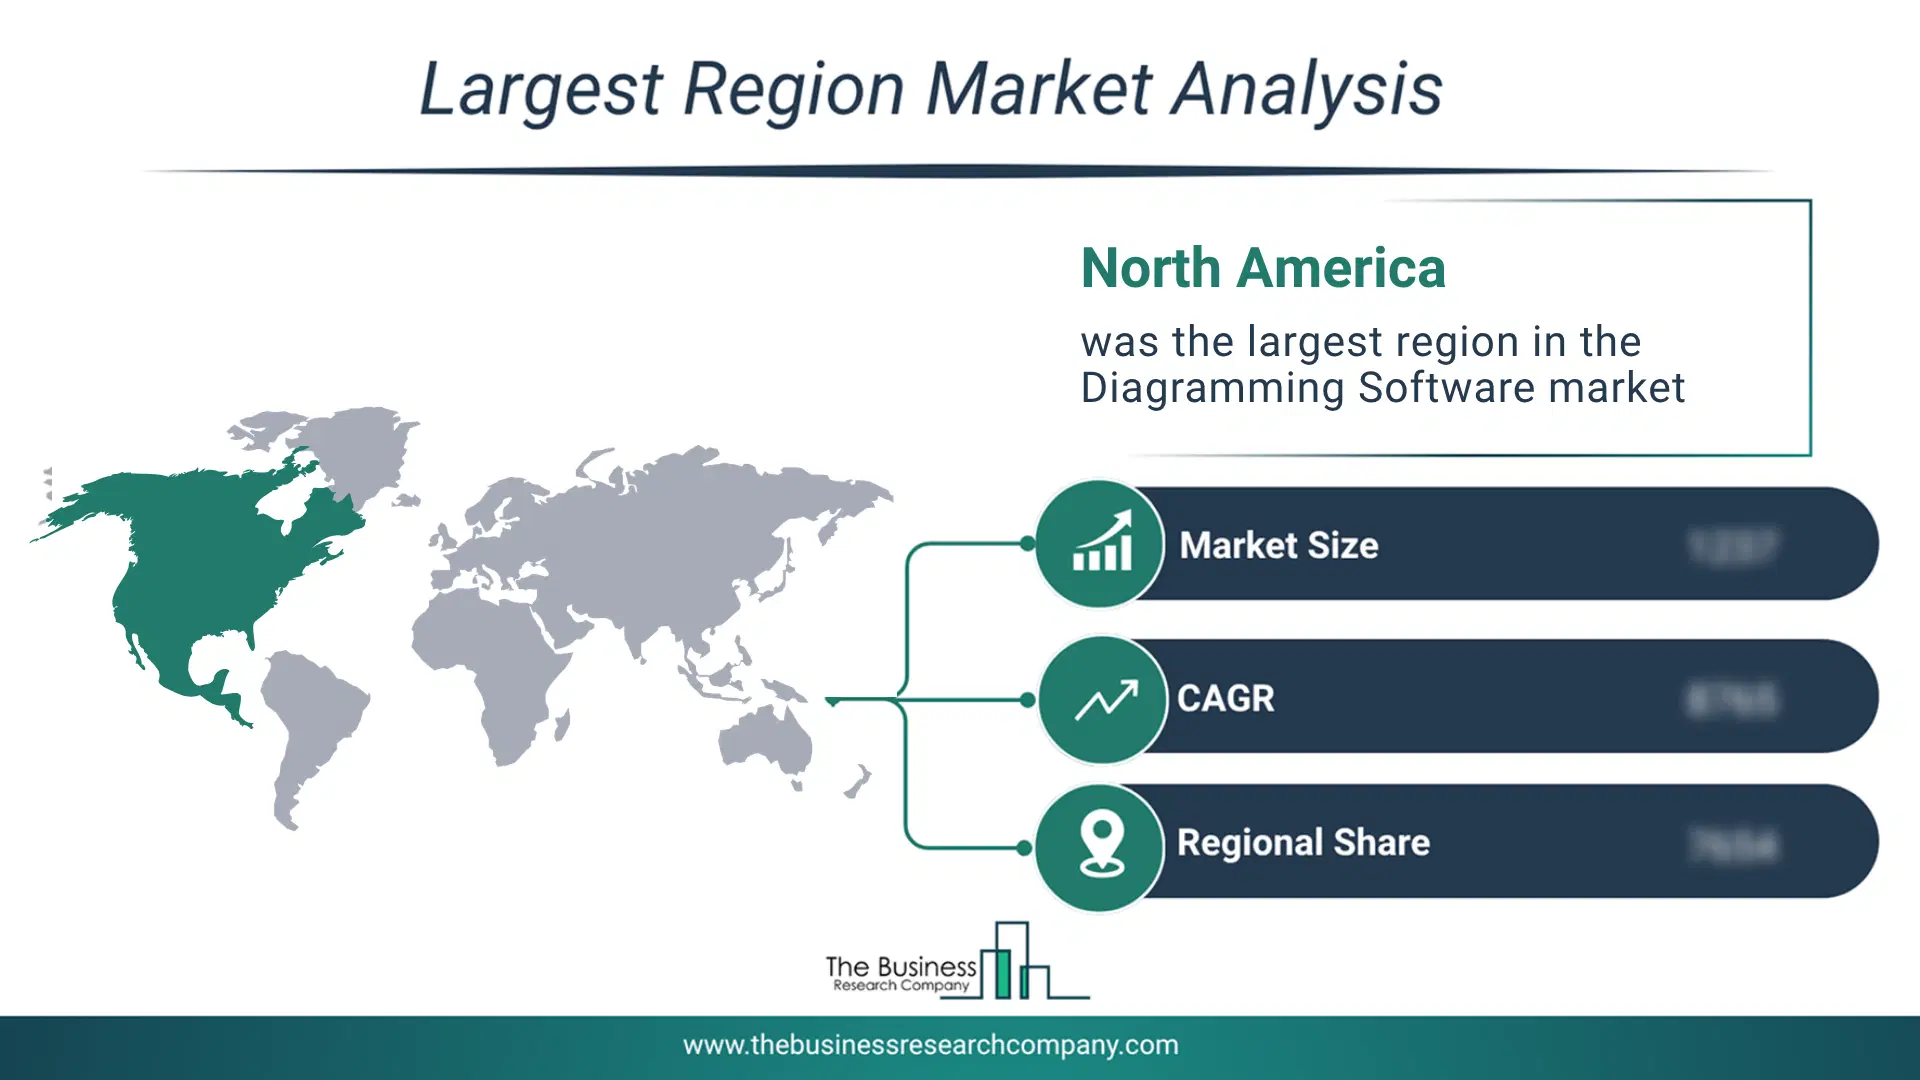
Regional Insights
North America was the largest region in the diagramming software market in 2025. The regions covered in this market report are Asia-Pacific, South East Asia, Western Europe, Eastern Europe, North America, South America, Middle East, Africa. The countries covered in this market report are Australia, Brazil, China, France, Germany, India, Indonesia, Japan, Taiwan, Russia, South Korea, UK, USA, Canada, Italy, Spain.What Defines the Diagramming Software Market?
The diagramming software market includes revenues earned by entities by providing services subscription plans or licenses, training and certification, customization services, integration services, and consulting services. The market value includes the value of related goods sold by the service provider or included within the service offering. Only goods and services traded between entities or sold to end consumers are included.How is Market Value Defined and Measured?
The market value is defined as the revenues that enterprises gain from the sale of goods and/or services within the specified market and geography through sales, grants, or donations in terms of the currency (in USD unless otherwise specified). The revenues for a specified geography are consumption values that are revenues generated by organizations in the specified geography within the market, irrespective of where they are produced. It does not include revenues from resales along the supply chain, either further along the supply chain or as part of other products.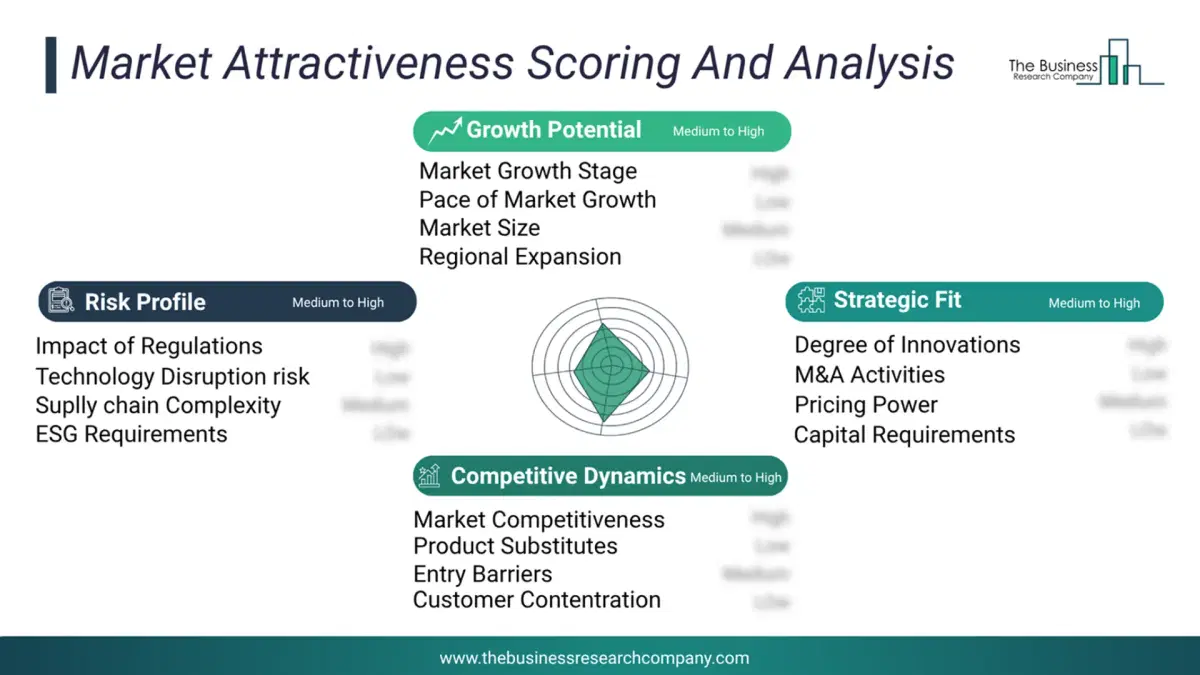
This chart presents market attractiveness based on a quantitative evaluation of growth, competition, strategic alignment, and risk, offering a clear view of opportunity areas for decision-making. This chart is for illustrative purposes; the full report contains the complete analysis.
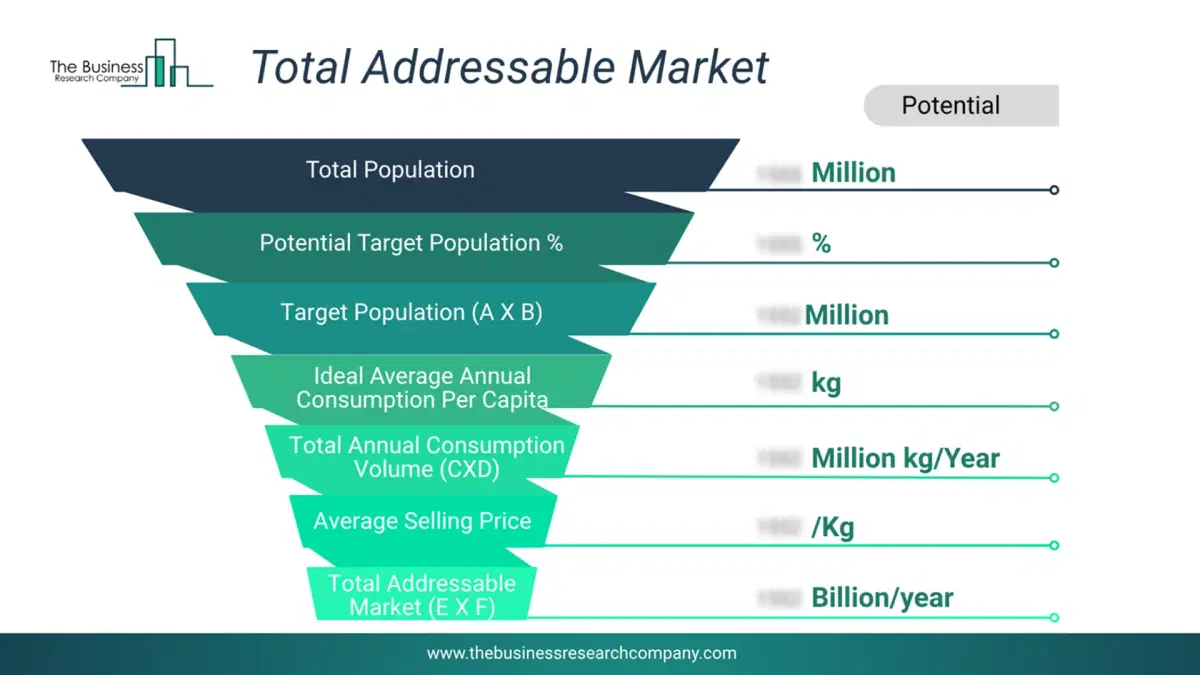
This chart highlights the Total Addressable Market (TAM) by estimating the maximum revenue opportunity using an assumption-driven approach, supporting strategic planning and opportunity sizing across markets. The chart is illustrative; the full report provides a more comprehensive analysis.
What Key Data and Analysis Are Included in the Diagramming Software Market Report 2026?
The diagramming software market research report is one of a series of new reports from The Business Research Company that provides market statistics, including industry global market size, regional shares, competitors with the market share, detailed market segments, market trends and opportunities, and any further data you may need to thrive in the diagramming software industry. The market research report delivers a complete perspective of everything you need, with an in-depth analysis of the current and future state of the industry.Diagramming Software Market Report Forecast Analysis
| Report Attribute | Details |
|---|---|
| Market Size Value In 2026 | $1.26 billion |
| Revenue Forecast In 2030 | $1.88 billion |
| Growth Rate | CAGR of 10.5% from 2026 to 2030 |
| Base Year For Estimation | 2025 |
| Actual Estimates/Historical Data | 2020-2025 |
| Forecast Period | 2026 - 2030 |
| Market Representation | Revenue in USD Billion and CAGR from 2026 to 2030 |
| Segments Covered | Type, Enterprise Size, Application |
| Regional Scope | Asia-Pacific, Western Europe, Eastern Europe, North America, South America, Middle East, Africa |
| Country Scope | The Countries Covered In This Market Report Are Australia, Brazil, China, France, Germany, India, Indonesia, Japan, Taiwan, Russia, South Korea, Uk, Usa, Canada, Italy, Spain. |
| Key Companies Profiled | Microsoft Corporation, Canva Pty Ltd., Miro Technologies Inc., Lucid Software Inc., Prezi Inc., Smartdraw LLC, Nulab Inc., Piktochart, Gliffy Inc., Venngage Inc., Pingboard Inc., Visio, Vizzlo GmbH, Cinergix Pty Ltd, DIA Developers India Pvt. Ltd., Slickplan, Edrawsoft, Corel Corporation, MindFusion Group, Zen Flowchart, Creately |
| Customization Scope | Request for Customization |
| Pricing And Purchase Options | Explore Purchase Options |