

Fleet Card Market Report 2026
Global Outlook – By Type (Credit Fleet Cards, Debit Fleet Cards, Prepaid Fleet Cards), By Vehicle Type (Light Commercial Vehicles, Heavy Commercial Vehicles, Passenger Vehicles), By Issuer Brand Type (Branded Fleet Cards, Universal Merchant Fleet Cards, Merchant Fleet Cards), By Application (Fuel Payments, Vehicle Maintenance Payments, Toll Payments, Parking Payments, Other Applications), By Industry (Transportation And Logistics, Construction, Government, Retail And Distribution, Manufacturing, Oil And Gas, Other Industries) – Market Size, Trends, Strategies, and Forecast to 2030
Fleet Card Market Overview
• Fleet Card market size has reached to $23.67 billion in 2025 • Expected to grow to $34.98 billion in 2030 at a compound annual growth rate (CAGR) of 8.0% • Growth Driver: Increasing Adoption Of Digital Payment Solutions Driving The Market Due To Rising Smartphone Penetration • Market Trend: Multi-Modal Fleet Payment Solutions Innovations Driving Fleet Electrification And Payment Efficiency • North America was the largest region in 2025 and Asia-Pacific is the fastest growing region.What Is Covered Under Fleet Card Market?
A fleet card is a specialized payment card designed for organizations that manage vehicle fleets, enabling centralized control of vehicle-related expenses through a dedicated payment system. It serves as a financial management solution that enhances cost visibility, spending control, and operational efficiency for fleet operators. The main types of fleet cards include credit fleet cards, debit fleet cards, and prepaid fleet cards. Credit fleet cards refer to payment cards that allow fleet operators to purchase fuel and other vehicle-related services on credit, helping businesses manage fleet expenses and track spending. These cards are used for light commercial vehicles, heavy commercial vehicles, and passenger vehicles and are issued as branded fleet cards, universal merchant fleet cards, and merchant fleet cards. The various applications involved are fuel payments, vehicle maintenance payments, toll payments, parking payments, and others, and they are used by several industries such as transportation and logistics, construction, government, retail and distribution, manufacturing, oil and gas, and others.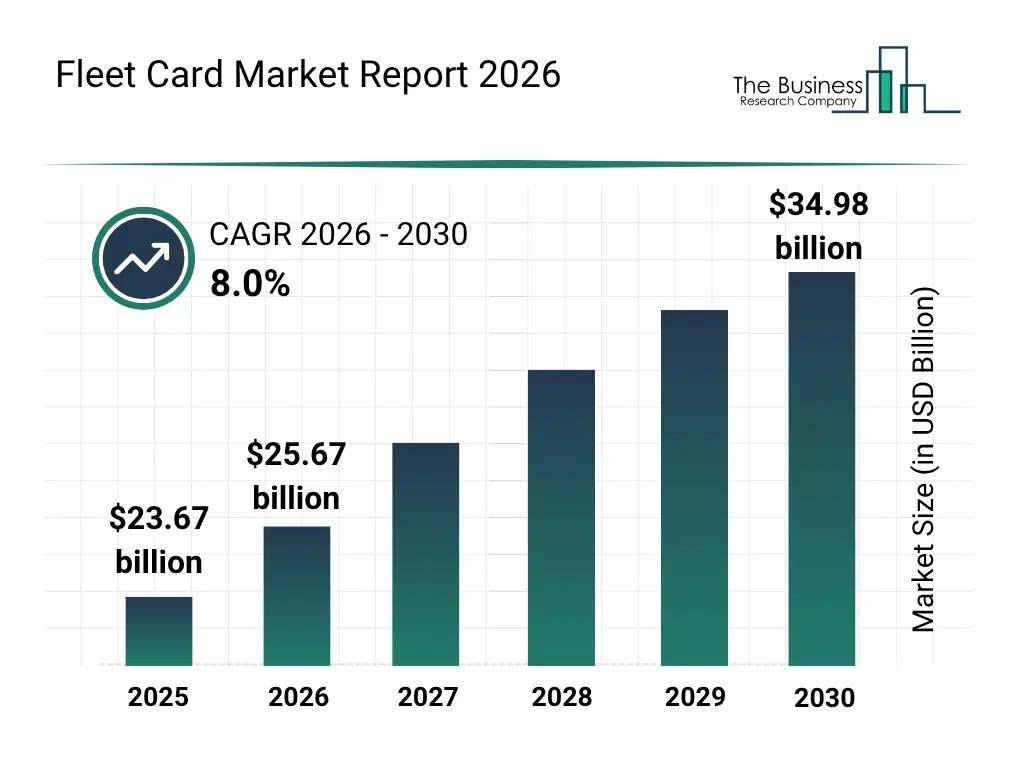
What Is The Fleet Card Market Size and Share 2026?
The fleet card market size has grown strongly in recent years. It will grow from $23.67 billion in 2025 to $25.67 billion in 2026 at a compound annual growth rate (CAGR) of 8.5%. The growth in the historic period can be attributed to increasing adoption of centralized fleet expense management, rising demand for fuel expense control, growing need for improved fleet cost visibility, increasing number of commercial vehicle fleets, expanding use of electronic payment methods for fleet expenses.What Is The Fleet Card Market Growth Forecast?
The fleet card market size is expected to see strong growth in the next few years. It will grow to $34.98 billion in 2030 at a compound annual growth rate (CAGR) of 8.0%. The growth in the forecast period can be attributed to increasing demand for real-time fleet spending monitoring, rising need for automated expense reconciliation, growing demand for integrated fleet payment solutions, increasing adoption of configurable spending controls, expanding use of fleet cards across diverse fleet operations. Major trends in the forecast period include increasing adoption of centralized fleet expense management, rising demand for real-time fleet spending visibility, growing preference for automated fuel expense tracking, increasing demand for customizable fleet spending controls, expanding use of fleet cards for multi-vehicle expense management.
Global Fleet Card Market Segmentation
1) By Type: Credit Fleet Cards, Debit Fleet Cards, Prepaid Fleet Cards 2) By Vehicle Type: Light Commercial Vehicles, Heavy Commercial Vehicles, Passenger Vehicles 3) By Issuer Brand Type: Branded Fleet Cards, Universal Merchant Fleet Cards, Merchant Fleet Cards 4) By Application: Fuel Payments, Vehicle Maintenance Payments, Toll Payments, Parking Payments, Other Applications 5) By Industry: Transportation And Logistics, Construction, Government, Retail And Distribution, Manufacturing, Oil And Gas, Other Industries Subsegments: 1) By Credit Fleet Cards: Single Network Credit Fleet Cards, Multi Network Credit Fleet Cards, Corporate Credit Fleet Cards, Commercial Credit Fleet Cards 2) By Debit Fleet Cards: Personal Identification Number Based Debit Fleet Cards, Signature Debit Fleet Cards, Business Debit Fleet Cards, Commercial Debit Fleet Cards 3) By Prepaid Fleet Cards: Reloadable Prepaid Fleet Cards, Non Reloadable Prepaid Fleet Cards, Open Loop Prepaid Fleet Cards, Closed Loop Prepaid Fleet CardsWhat Is The Driver Of The Fleet Card Market?
The increasing adoption of digital payment solutions is expected to propel the growth of the fleet card market going forward. Digital payment solutions are technologies and platforms that enable secure electronic transactions, allowing individuals and businesses to send, receive, and process payments without using cash. Digital payment solutions are increasing due to the widespread adoption of smartphones, which enables users to make fast, convenient, and secure transactions anytime and anywhere through mobile payment applications. The increasing adoption of digital payment solutions supports fleet cards by enabling secure, cashless, and real-time transaction processing, improving expense control, operational efficiency, and fleet management. For instance, in July 2024, according to UK Finance Limited, a UK-based trade association, the proportion of adults registered for mobile payments rose from 30% in 2022 to 42% in 2023, with 98% of registrants making payments and 82% doing so monthly, resulting in 34% of the overall population using mobile contactless payments each month. Therefore, the increasing adoption of digital payment solutions is driving the growth of the fleet card industry.Key Players In The Global Fleet Card Market
Major companies operating in the fleet card market are China Petroleum & Chemical Corporation, PetroChina Company Limited, Exxon Mobil Corporation, Shell plc, TotalEnergies SE, BP p.l.c., Chevron Corporation, Indian Oil Corporation Limited, Alimentation Couche-Tard Inc., ENEOS Holdings Inc., Bharat Petroleum Corporation Limited, Hindustan Petroleum Corporation Limited, EG Group Limited, Valero Energy Corporation, U.S. Bancorp, OMV Aktiengesellschaft, MOL Hungarian Oil and Gas Public Limited Company, Corpay Inc., Edenred SE, WEX Inc., Eurowag, DKV Mobility Group SE, Radius Limited
This chart is for illustrative purposes; the full report includes a detailed competitor analysis and comprehensive overview of the top 10 companies in the market.
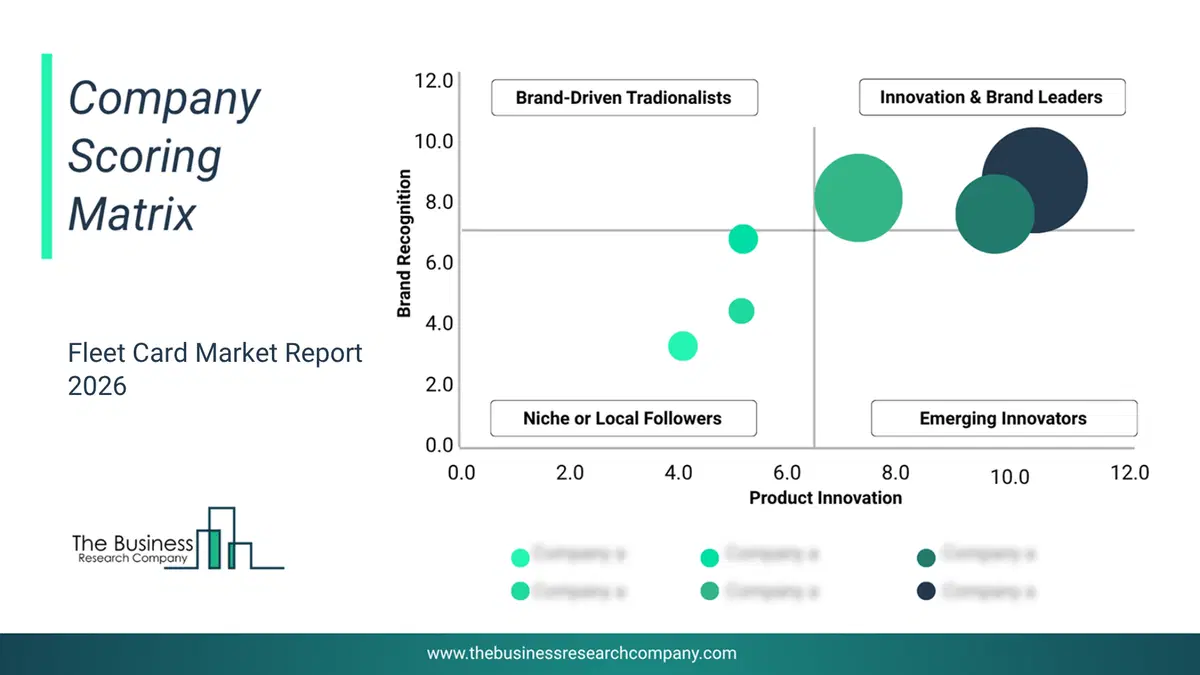
This chart maps companies by product innovation and brand strength, with bubble size indicating relative revenue, helping identify market leaders, challengers, and niche players. This is an illustrative chart; the full report provides a complete and accurate competitive analysis.
Global Fleet Card Market Trends and Insights
Major companies operating in the fleet card market are focusing on developing innovative solutions such as multi-modal fleet payment to streamline payment processes across conventional fueling and electric vehicle charging while supporting fleet electrification and operational efficiency. Multi-modal fleet payment refers to integrated payment platforms that enable fleet operators to manage and pay for multiple vehicle energy sources, including conventional fuel and electric vehicle charging, through a single payment system. For instance, in January 2026, WEX Inc., a US-based financial technology company, launched the WEX Fleet Card, now with EV payment capabilities, a multi-modal fleet payment solution designed to enable fleet drivers to pay for both traditional fuel purchases and public electric vehicle charging using a single fleet card. It offers benefits such as unified payment management, expanded access to public EV charging networks, and simplified fleet expense tracking. The launch aims to help customers improve payment convenience and support mixed-fleet operations while advancing fleet electrification and operational efficiency.What Are Latest Mergers And Acquisitions In The Fleet Card Market?
In October 2025, NCR Voyix Corporation, a US-based digital commerce solutions company, partnered with Corpay Inc. to enable Corpay fleet card acceptance for commercial fuel transactions. Through this partnership, the companies aim to simplify and expand secure fleet payment processing at fuel stations, enhance the fuelling experience for commercial fleets, and strengthen digital payment capabilities for fuel retailers. Corpay, Inc. is a US-based corporate payments company that provides fleet cards, vehicle expense management, travel payment solutions, accounts payable automation, and cross-border payment services for businesses.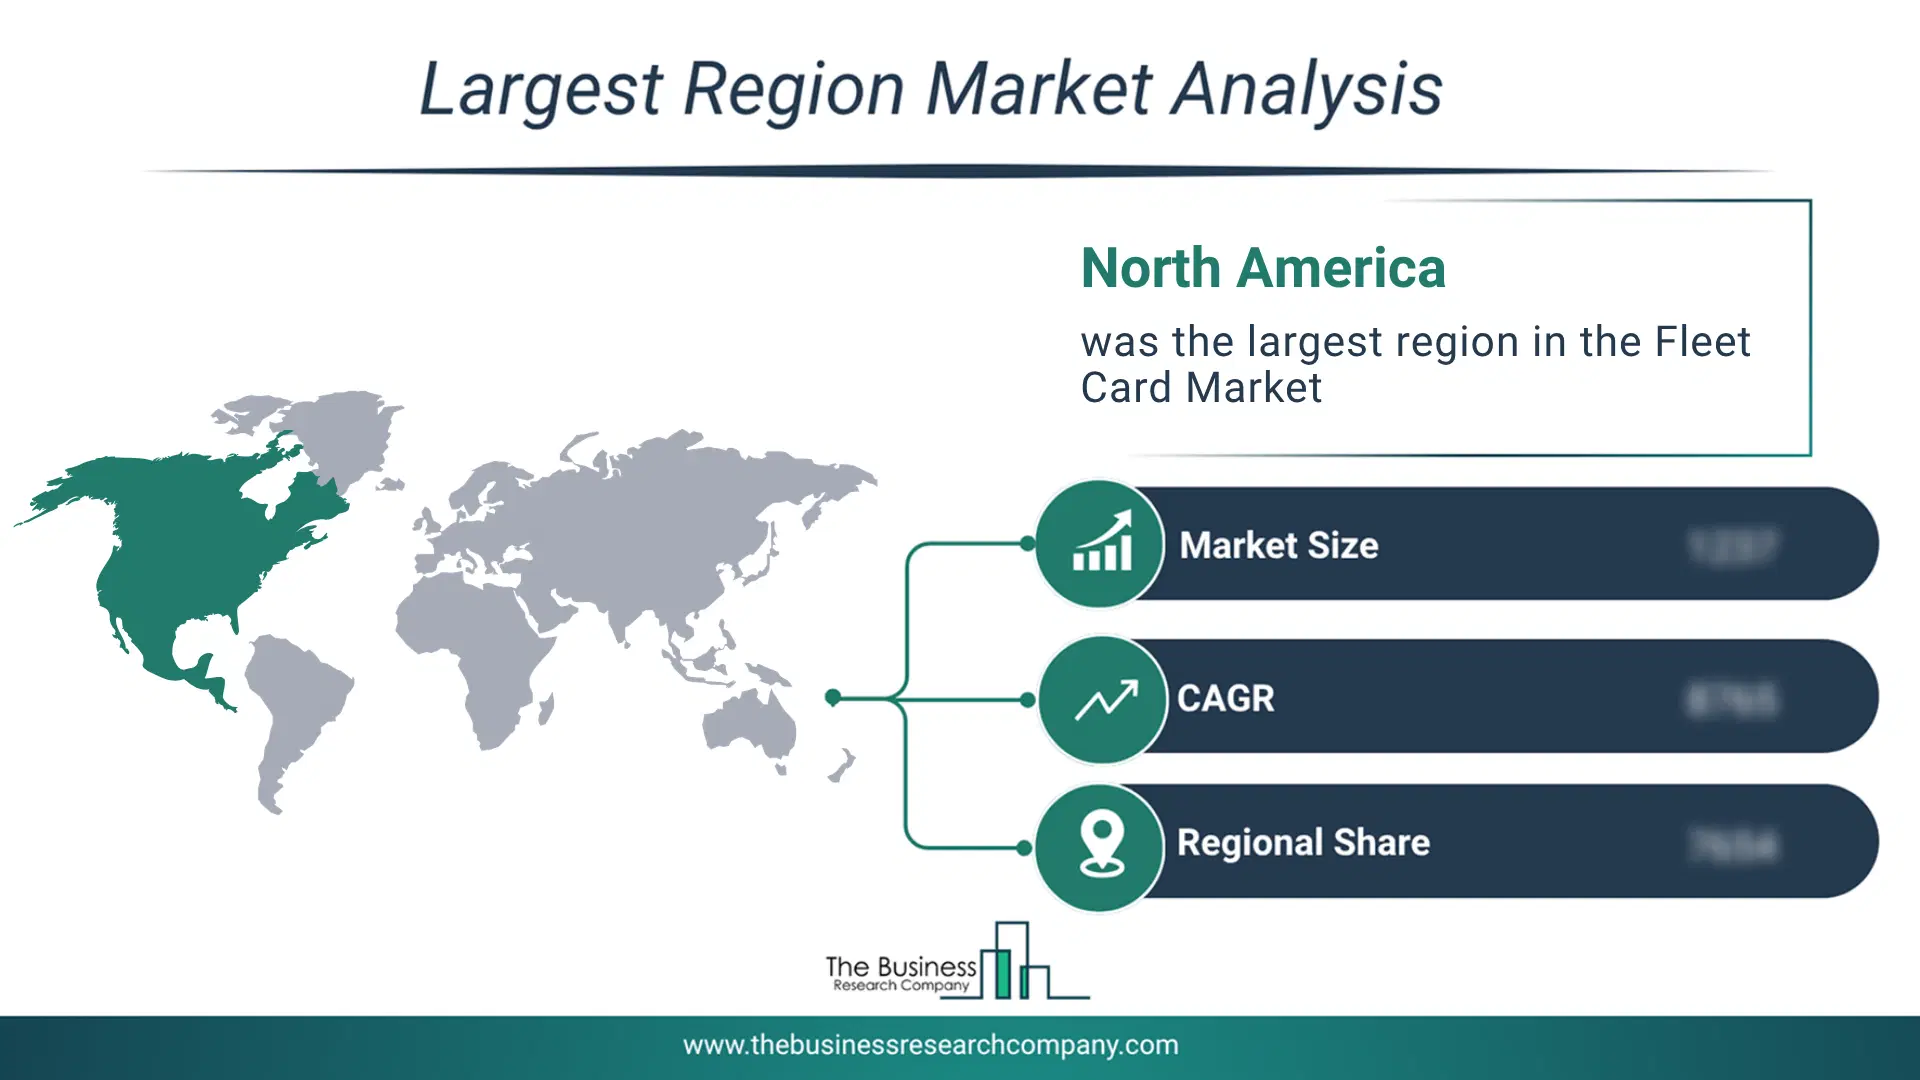
Regional Insights
North America was the largest region in the fleet card market in 2025. Asia-Pacific is expected to be the fastest-growing region in the forecast period. The regions covered in this market report are Asia-Pacific, South East Asia, Western Europe, Eastern Europe, North America, South America, Middle East, Africa. The countries covered in this market report are Australia, Brazil, China, France, Germany, India, Indonesia, Japan, Taiwan, Russia, South Korea, UK, USA, Canada, Italy, Spain.What Defines the Fleet Card Market?
The fleet card market includes revenues earned by entities by providing services such as expense management, fleet expense reporting, driver identification and authentication, and purchase controls and spending limits. The market value includes the value of related goods sold by the service provider or included within the service offering. Only goods and services traded between entities or sold to end consumers are included.How is Market Value Defined and Measured?
The market value is defined as the revenues that enterprises gain from the sale of goods and/or services within the specified market and geography through sales, grants, or donations in terms of the currency (in USD unless otherwise specified). The revenues for a specified geography are consumption values that are revenues generated by organizations in the specified geography within the market, irrespective of where they are produced. It does not include revenues from resales along the supply chain, either further along the supply chain or as part of other products.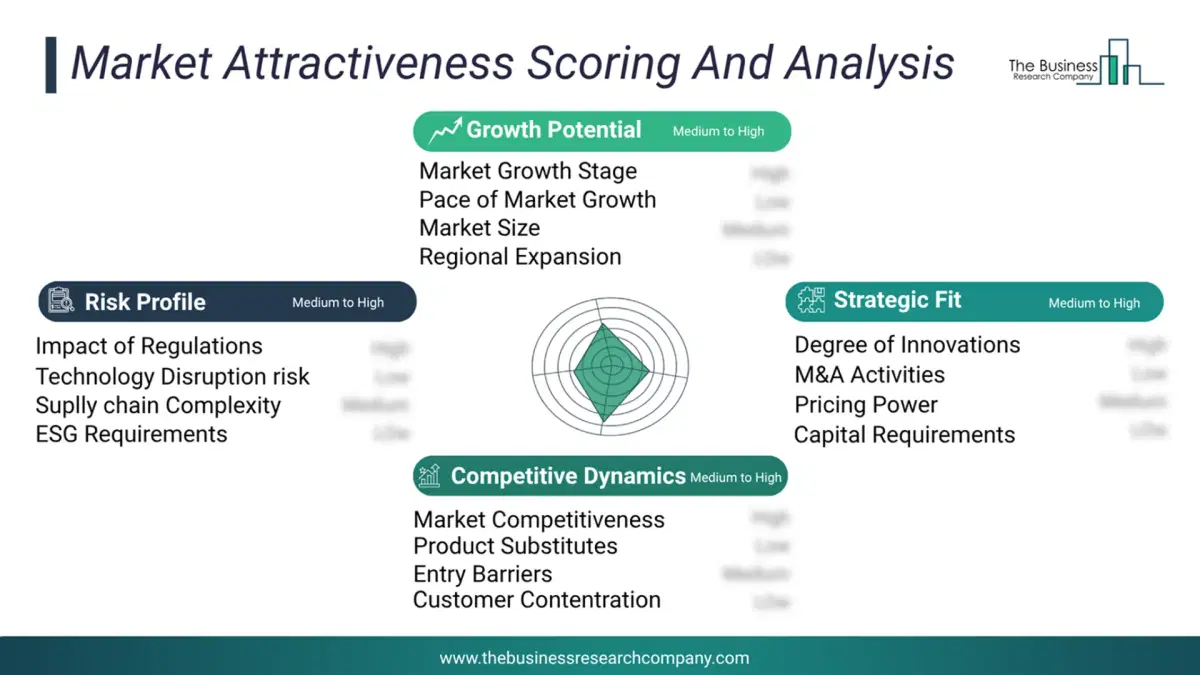
This chart presents market attractiveness based on a quantitative evaluation of growth, competition, strategic alignment, and risk, offering a clear view of opportunity areas for decision-making. This chart is for illustrative purposes; the full report contains the complete analysis.
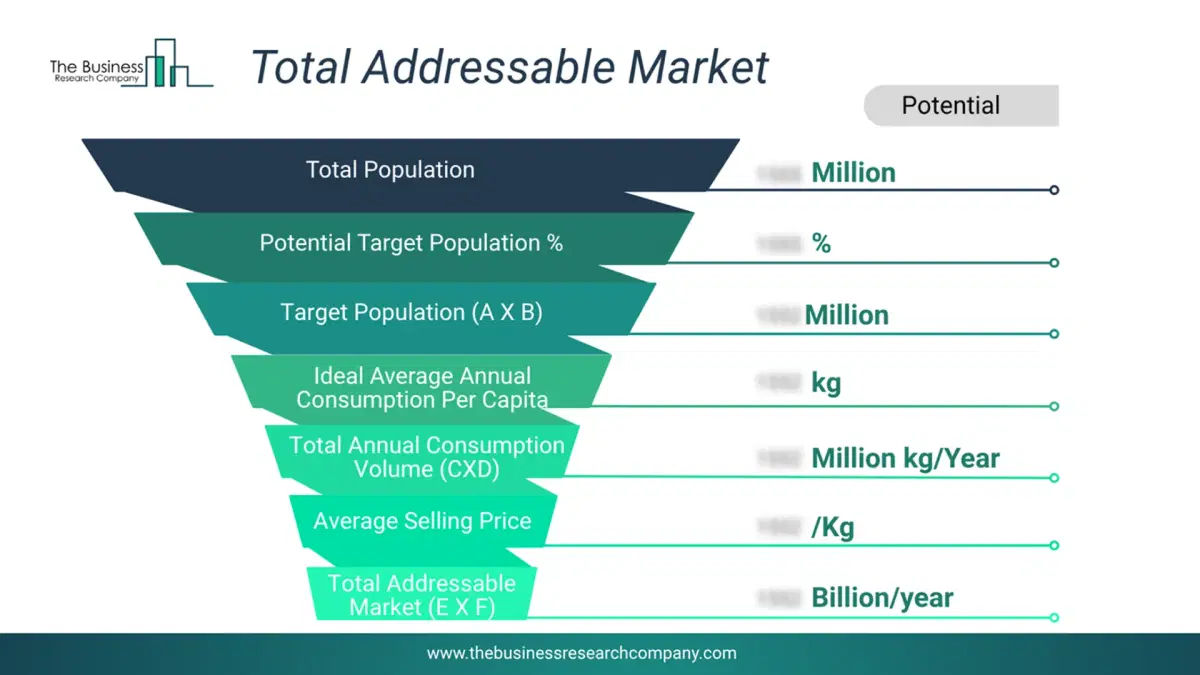
This chart highlights the Total Addressable Market (TAM) by estimating the maximum revenue opportunity using an assumption-driven approach, supporting strategic planning and opportunity sizing across markets. The chart is illustrative; the full report provides a more comprehensive analysis.
What Key Data and Analysis Are Included in the Fleet Card Market Report 2026?
The fleet card market research report is one of a series of new reports from The Business Research Company that provides market statistics, including industry global market size, regional shares, competitors with the market share, detailed market segments, market trends and opportunities, and any further data you may need to thrive in the fleet card industry. The market research report delivers a complete perspective of everything you need, with an in-depth analysis of the current and future state of the industry.Fleet Card Market Report Forecast Analysis
| Report Attribute | Details |
|---|---|
| Market Size Value In 2026 | $25.67 billion |
| Revenue Forecast In 2030 | $34.98 billion |
| Growth Rate | CAGR of 8.0% from 2026 to 2030 |
| Base Year For Estimation | 2025 |
| Actual Estimates/Historical Data | 2020-2025 |
| Forecast Period | 2026 - 2030 |
| Market Representation | Revenue in USD Billion and CAGR from 2026 to 2030 |
| Segments Covered | Type, Vehicle Type, Issuer Brand Type, Application, Industry |
| Regional Scope | Asia-Pacific, Western Europe, Eastern Europe, North America, South America, Middle East, Africa |
| Country Scope | The countries covered in the report are Australia, Brazil, China, France, Germany, India, Indonesia, Japan, Taiwan, Russia, South Korea, UK, USA, Canada, Italy, Spain. |
| Key Companies Profiled | China Petroleum & Chemical Corporation, PetroChina Company Limited, Exxon Mobil Corporation, Shell plc, TotalEnergies SE, BP p.l.c., Chevron Corporation, Indian Oil Corporation Limited, Alimentation Couche-Tard Inc., ENEOS Holdings Inc., Bharat Petroleum Corporation Limited, Hindustan Petroleum Corporation Limited, EG Group Limited, Valero Energy Corporation, U.S. Bancorp, OMV Aktiengesellschaft, MOL Hungarian Oil and Gas Public Limited Company, Corpay Inc., Edenred SE, WEX Inc., Eurowag, DKV Mobility Group SE, Radius Limited |
| Customization Scope | Request for Customization |
| Pricing And Purchase Options | Explore Purchase Options |