
Galvanic Isolation Market Report 2026
Global Outlook – By Type ( Analog Galvanic Isolation, Digital Galvanic Isolation), By Data Range ( Above 75 Mbps, 25-75 Mbps, 25 Mbps), By Channel ( Two Channels, Four Channels, Six Channels, Eight Channels, Other Channels), By Sales Channel ( Online Retail, Direct Sales), By Application ( Healthcare, Telecommunications, Manufacturing, Energy, Automotive, Aerospace And Defense, Consumer Electronics, Other Applications) – Market Size, Trends, Strategies, and Forecast to 2030
Galvanic Isolation Market Overview
• Galvanic Isolation market size has reached to $2.12 billion in 2025 • Expected to grow to $3.04 billion in 2030 at a compound annual growth rate (CAGR) of 7.2% • Growth Driver: Galvanic Isolation Market Propelled By Renewable Energy Expansion • Market Trend: Socomec Advances Industrial Reliability In Galvanic Isolation Technology Market • North America was the largest region in 2025 and Asia-Pacific is the fastest growing region.What Is Covered Under Galvanic Isolation Market?
Galvanic isolation refers to the practice of separating the input and output supplies of a device to facilitate the flow of current either through a field or electrical connections. It enables the transfer of power between two circuits that should remain uncoupled. The primary purpose of establishing isolation is to enhance safety in industrial-grade products, particularly in scenarios where wired communication is necessary between two devices, each independently controlling its power. The main types of galvanic isolation are analog galvanic isolation and digital galvanic isolation. Analog galvanic isolation refers to circuitry that effectively segregates the pH input circuit from all other electronics within the system, offering comprehensive isolation. The data range includes above 75 mbps, 25-75 mbps, and 25 mbps, and various channels include two channels, four channels, six channels, eight channels, and others. It is sold through various sales channels, including online retail and direct sales, for several applications such as healthcare, telecommunications, manufacturing, energy, automotive, aerospace and defense, consumer electronics, and others.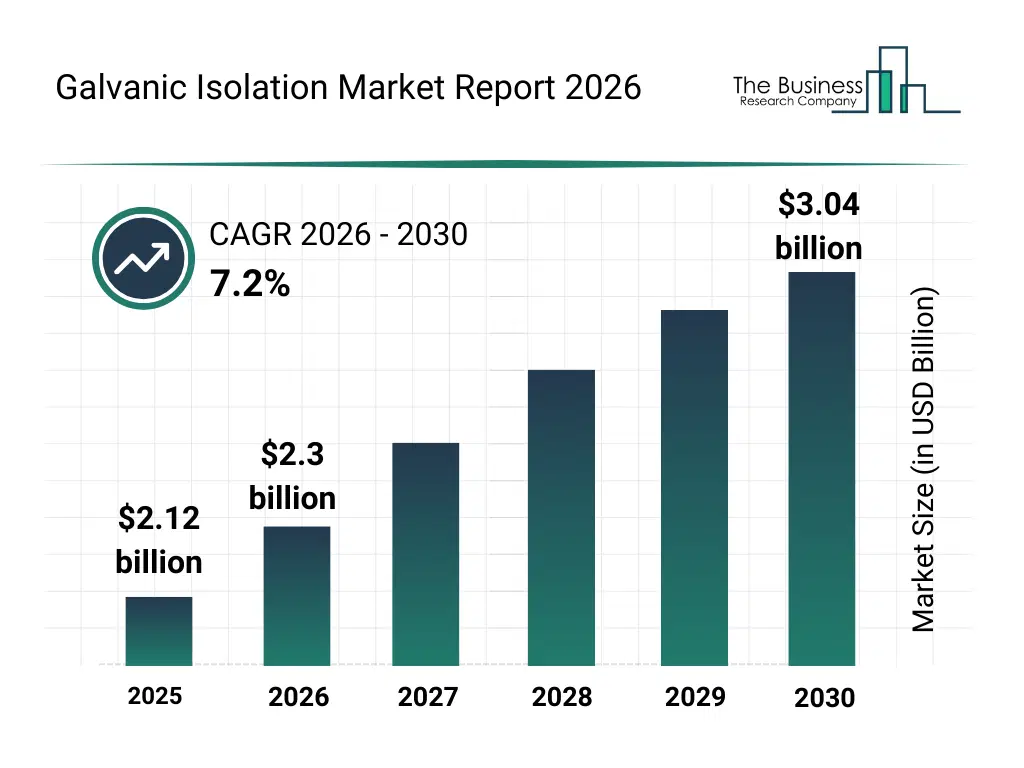
What Is The Galvanic Isolation Market Size 2026 And Growth Rate?
The galvanic isolation market size has grown strongly in recent years. It will grow from $2.12 billion in 2025 to $2.3 billion in 2026 at a compound annual growth rate (CAGR) of 8.3%. The growth in the historic period can be attributed to need for electrical safety in industrial systems, growth of wired communication interfaces, rising deployment of automation control systems, early adoption of isolated amplifiers in medical devices, expansion of telecom networking infrastructure.What Is The Galvanic Isolation Market Growth Forecast?
The galvanic isolation market size is expected to see strong growth in the next few years. It will grow to $3.04 billion in 2030 at a compound annual growth rate (CAGR) of 7.2%. The growth in the forecast period can be attributed to increasing demand for high speed digital isolators, growth of electric vehicle power electronics, rising deployment of renewable energy systems, increasing adoption of advanced gate drivers, expansion of semiconductor miniaturization technologies. Major trends in the forecast period include growing demand for high precision isolation in industrial systems, increased adoption of isolation solutions in medical equipment, rising use of isolation components in power electronics, growing deployment of isolation technologies in telecom systems, enhanced focus on safety standards in high voltage applications.
Global Galvanic Isolation Market Segmentation
1) By Type: Analog Galvanic Isolation, Digital Galvanic Isolation 2) By Data Range: Above 75 Mbps, 25-75 Mbps, 25 Mbps 3) By Channel: Two Channels, Four Channels, Six Channels, Eight Channels, Other Channels 4) By Sales Channel: Online Retail, Direct Sales 5) By Application: Healthcare, Telecommunications, Manufacturing, Energy, Automotive, Aerospace And Defense, Consumer Electronics, Other Applications Subsegments: 1) By Analog Galvanic Isolation: Isolated Amplifiers, Isolated Sensors, Isolated Voltage Regulators 2) By Digital Galvanic Isolation: Digital Isolators, Isolated Gate Drivers, Isolated TransceiversWhat Is The Driver Of The Galvanic Isolation Market?
The growth of renewable energy sources is expected to propel the growth of the galvanic isolation market going forward. Renewable energy, commonly known as clean energy, originates from natural sources or ongoing processes that undergo continuous replenishment. Renewable energy sources are on the rise due to their increasing affordability, supportive government policies, and the growing global focus on sustainability and reducing carbon emissions. Galvanic isolation ensures safety and prevents ground loops in renewable energy systems by electrically separating components. In renewable energy systems such as solar photovoltaic (PV) and wind power generation, galvanic isolation provides a barrier between different electrical circuits, preventing the flow of current and eliminating ground loops. For instance, in December 2024, according to Eurostat, a Luxembourg-based statistical agency, the European Union reached a 24.5% share of its gross final energy consumption from renewable sources in 2023, up by approximately 1.4 percentage points from 2022. Therefore, the growth of renewable energy sources is driving the growth of the galvanic isolation industry.Key Players In The Global Galvanic Isolation Market
Major companies operating in the galvanic isolation market are Schneider Electric SE, Broadcom Inc, Toshiba Electronic Devices & Storage Corporation, Würth Elektronik, Eaton Corporation, Texas Instruments Incorporated, STMicroelectronics N.V, TDK Corporation, Infineon Technologies AG, Murata Manufacturing Co. Ltd, NXP Semiconductors N.V, Analog Devices Inc, Renesas Electronics Corporation, ROHM Semiconductor, Vishay Intertechnology, Maxim Integrated, Mornsun Power, Silicon Laboratories, Semtech Corporation, Pepperl+Fuchs GmbH, Power Integrations, RECOM Power GmbH, Perle Systems Europe Ltd, Professional Mariner LLC, Traco Electronic AG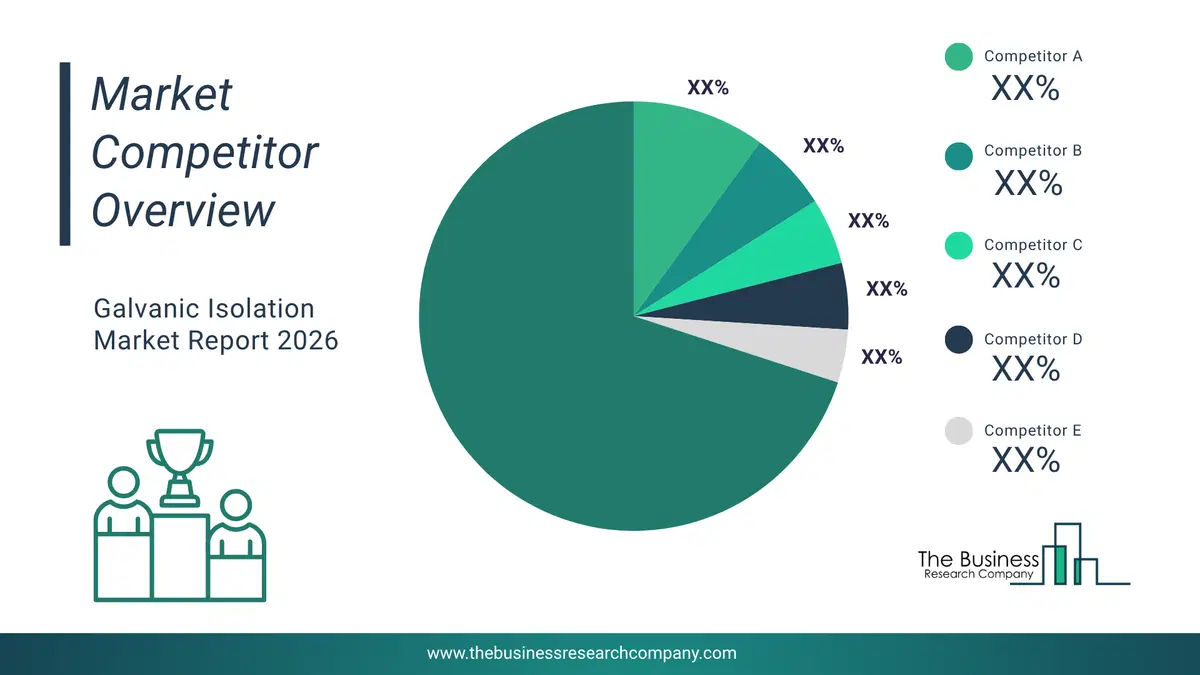
This chart is for illustrative purposes; the full report includes a detailed competitor analysis and comprehensive overview of the top 10 companies in the market.
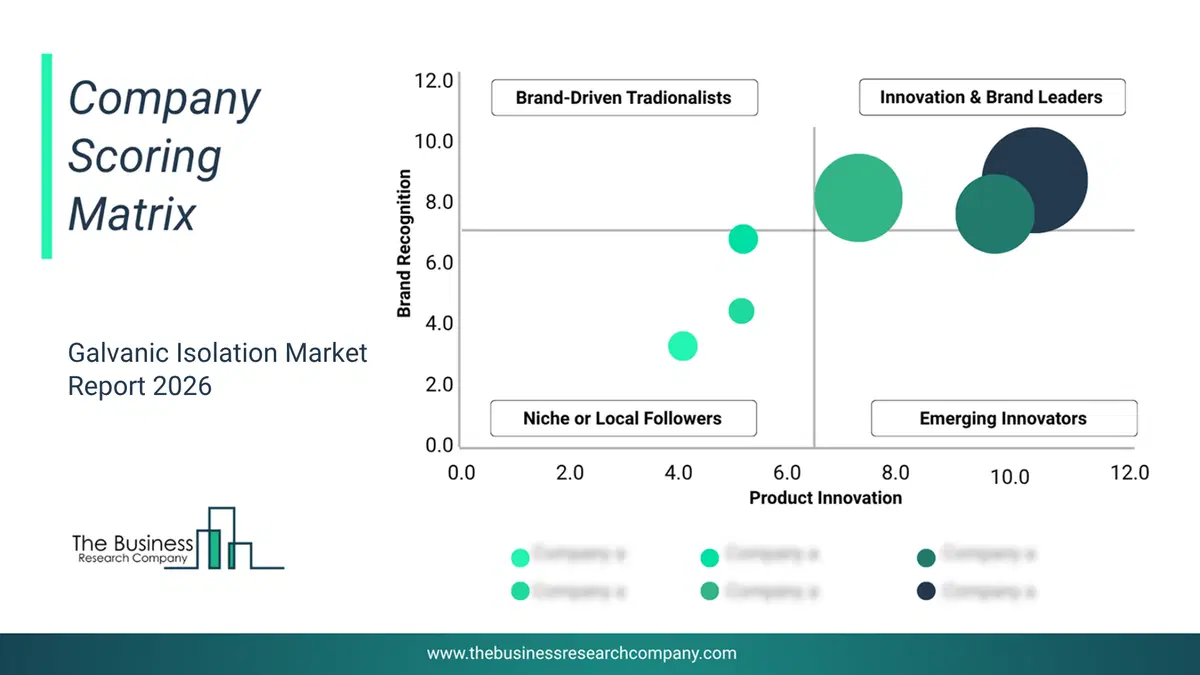
This chart maps companies by product innovation and brand strength, with bubble size indicating relative revenue, helping identify market leaders, challengers, and niche players. This is an illustrative chart; the full report provides a complete and accurate competitive analysis.
Global Galvanic Isolation Market Trends and Insights
Major companies operating in the galvanic isolation market are focusing on developing on advancing galvanic isolation technology to enhance their market position. Galvanic isolation electrically separates two circuits while enabling signal or power transfer, preventing ground loops, and increasing safety. For instance, in May 2024, Socomec, a France-based electronics manufacturing company, launched the DELPHYS MX Elite+ UPS, a high-performance uninterruptible power supply (UPS) tailored for demanding applications in sectors such as healthcare, IT, and infrastructure. Designed for challenging industrial environments, the DELPHYS MX Elite+ features a transformer-based design with IGBT (Insulated Gate Bipolar Transistor) architecture, ensuring robust reliability and efficiency. Operating in VFI (Voltage and Frequency Independent) mode, it provides stable power through online double conversion, crucial for sensitive equipment. The UPS offers capacities from 160 kVA to 600 kVA and supports parallel operation with up to six units, enabling scalability and redundancy.What Are Latest Mergers And Acquisitions In The Galvanic Isolation Market?
In January 2023, Branford Castle Partners, a US-based provider of investment services, acquired GPT Industries from EnPro Industries for an undisclosed amount. The acquisition was part of Branford's strategy to support GPT's growth and expand its products into new markets and geographies. GPT Industries is a US-based provider of galvanic isolation through their flange isolation products.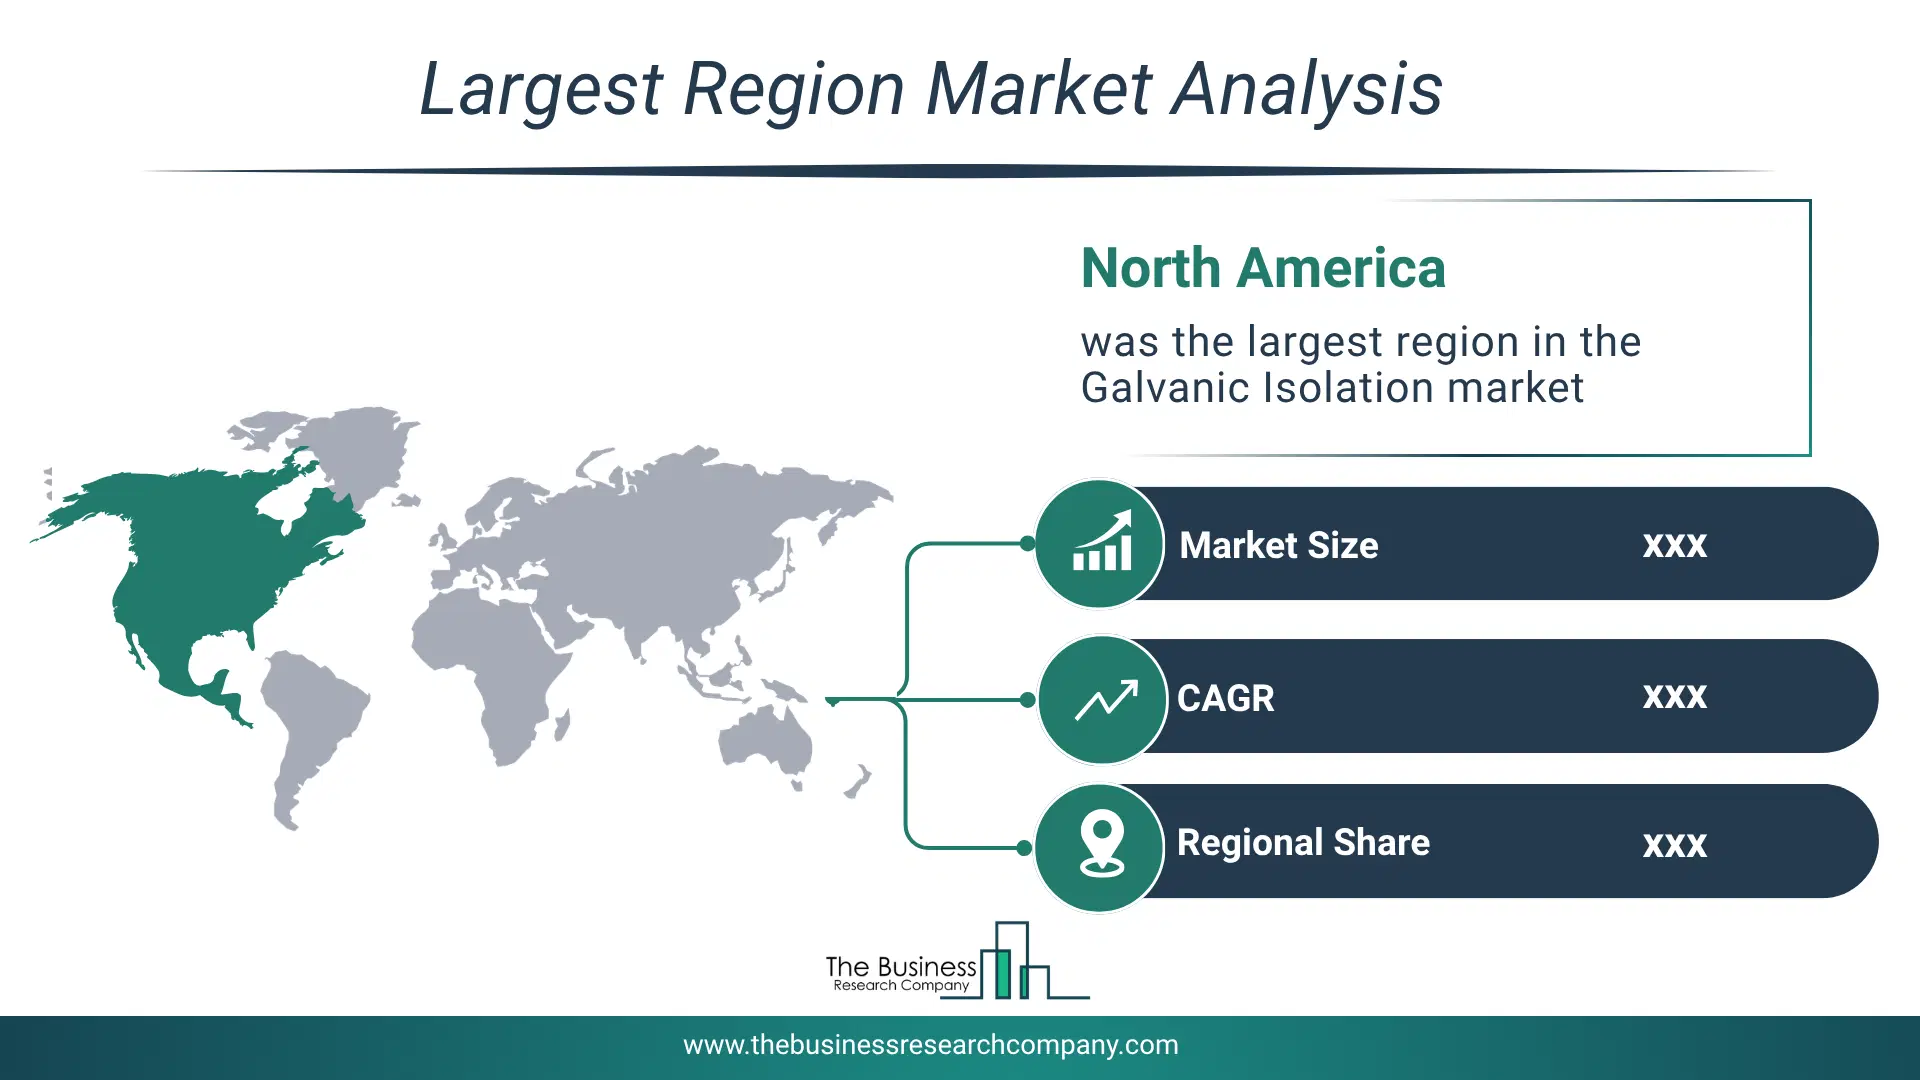
Regional Outlook
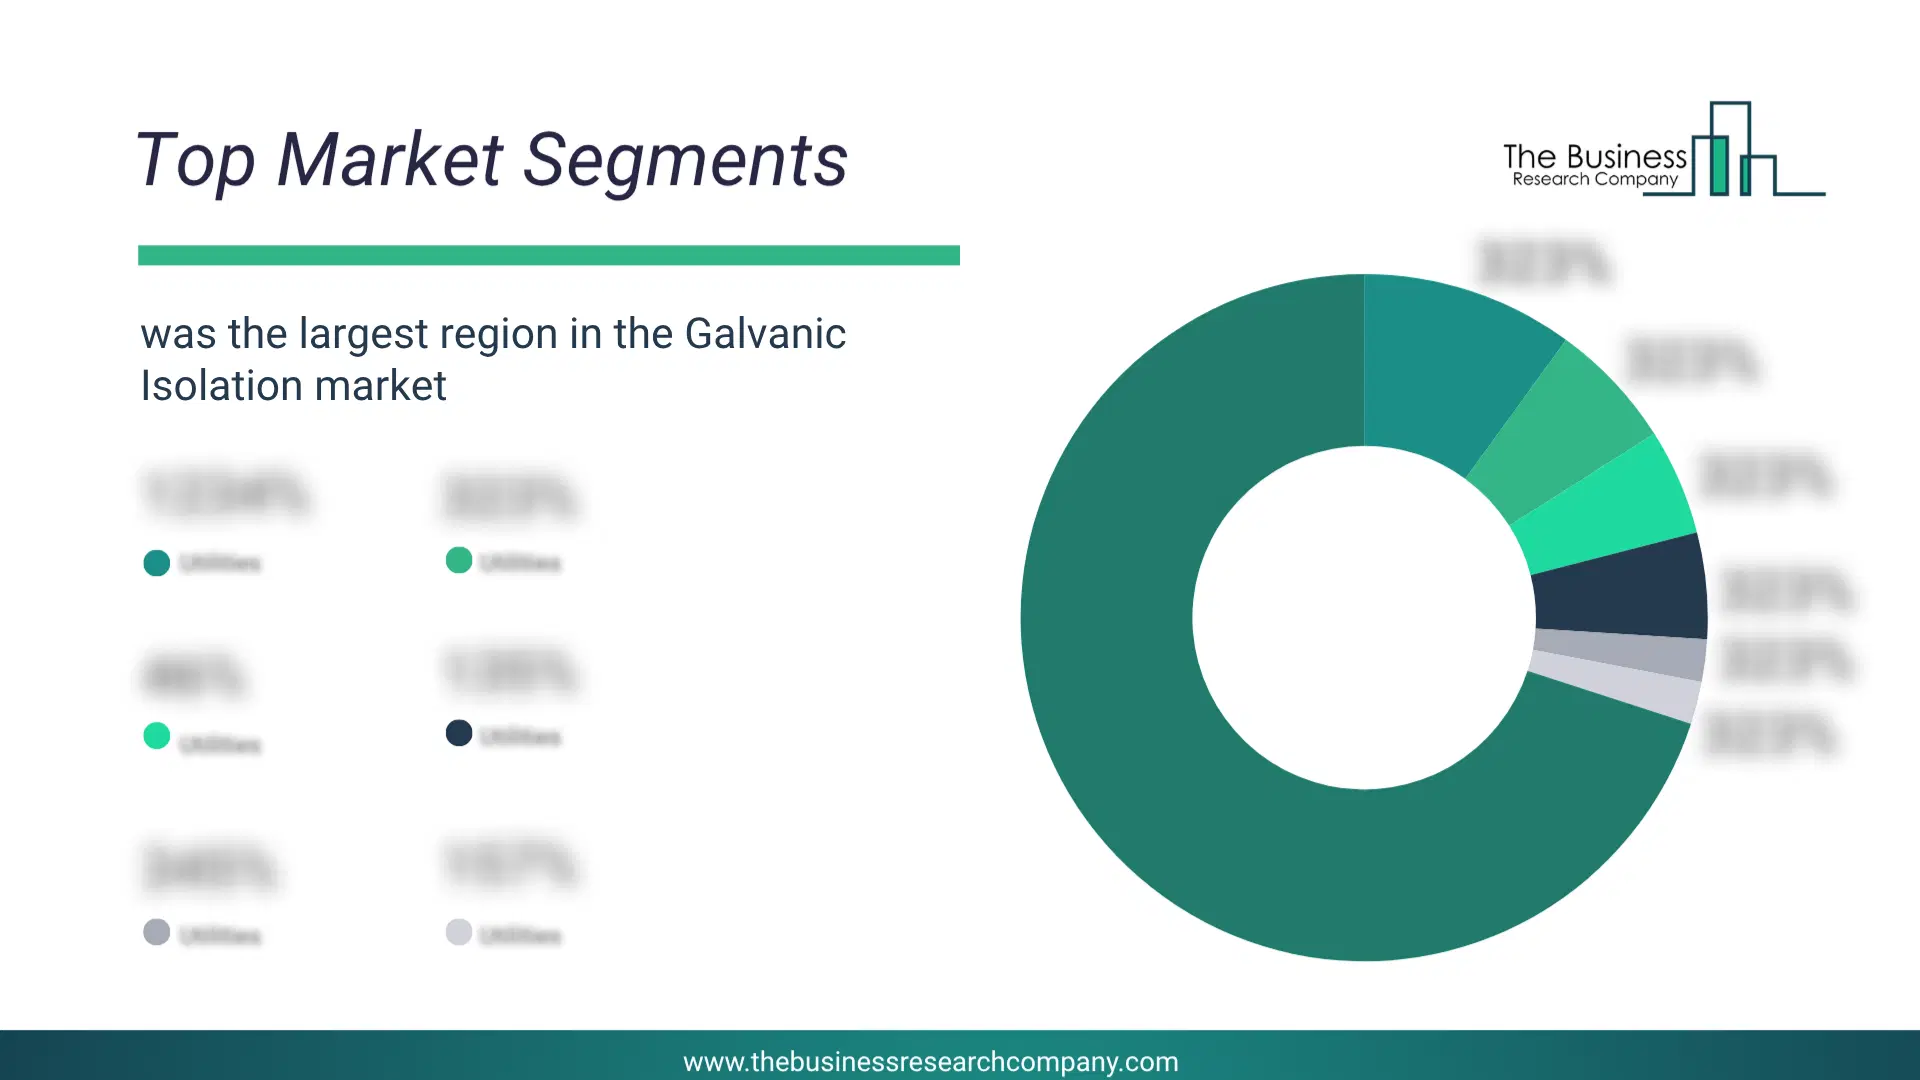
North America was the largest region in the galvanic isolation market in 2025. Asia-Pacific is expected to be the fastest-growing region in the forecast period. The regions covered in this market report are Asia-Pacific, South East Asia, Western Europe, Eastern Europe, North America, South America, Middle East, Africa. The countries covered in this market report are Australia, Brazil, China, France, Germany, India, Indonesia, Japan, Taiwan, Russia, South Korea, UK, USA, Canada, Italy, Spain.What Defines the Galvanic Isolation Market?
The galvanic isolation market consists of revenues earned by entities by providing services such as signal isolation, power isolation, and galvanic isolation in uninterruptible power supplies. The market value includes the value of related goods sold by the service provider or included within the service offering. The galvanic isolation market also includes sales of transformers, capacitors, opto-isolators, and hall effect sensors. Values in this market are ‘factory gate’ values, that is the value of goods sold by the manufacturers or creators of the goods, whether to other entities (including downstream manufacturers, wholesalers, distributors, and retailers) or directly to end customers. The value of goods in this market includes related services sold by the creators of the goods.How is Market Value Defined and Measured?
The market value is defined as the revenues that enterprises gain from the sale of goods and/or services within the specified market and geography through sales, grants, or donations in terms of the currency (in USD unless otherwise specified). The revenues for a specified geography are consumption values that are revenues generated by organizations in the specified geography within the market, irrespective of where they are produced. It does not include revenues from resales along the supply chain, either further along the supply chain or as part of other products.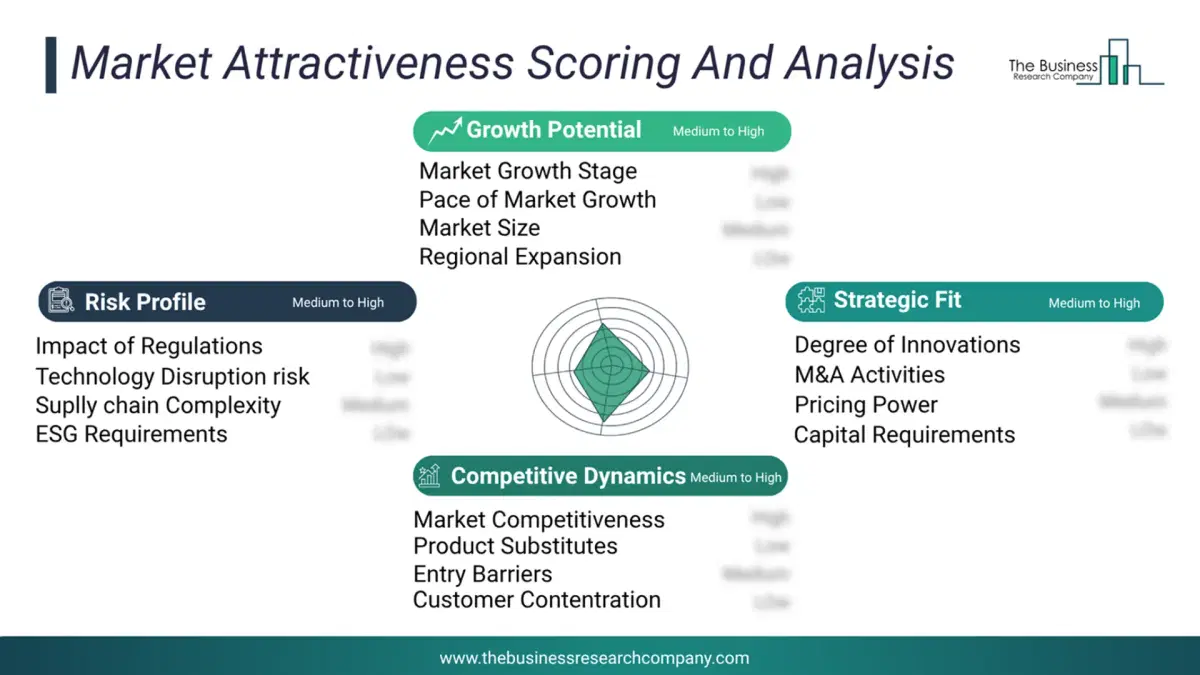
This chart presents market attractiveness based on a quantitative evaluation of growth, competition, strategic alignment, and risk, offering a clear view of opportunity areas for decision-making. This chart is for illustrative purposes; the full report contains the complete analysis.
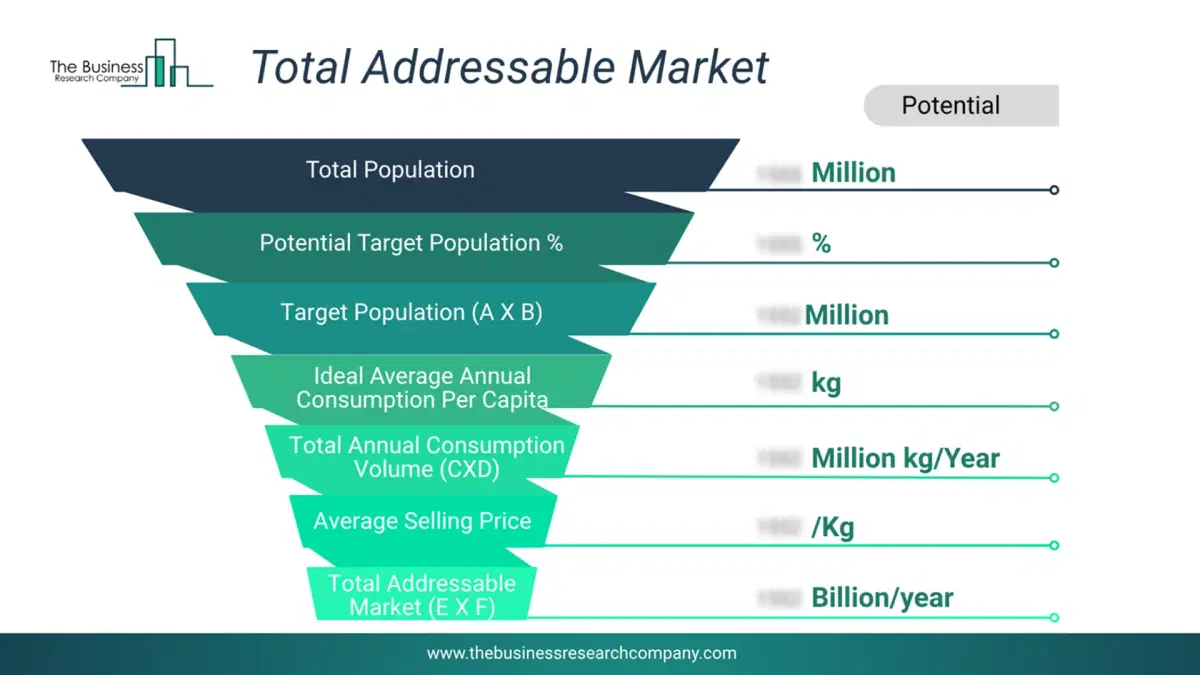
This chart highlights the Total Addressable Market (TAM) by estimating the maximum revenue opportunity using an assumption-driven approach, supporting strategic planning and opportunity sizing across markets. The chart is illustrative; the full report provides a more comprehensive analysis.
What Key Data and Analysis Are Included in the Galvanic Isolation Market Report 2026?
The galvanic isolation market research report is one of a series of new reports from The Business Research Company that provides market statistics, including industry global market size, regional shares, competitors with the market share, detailed market segments, market trends and opportunities, and any further data you may need to thrive in the galvanic isolation industry. The market research report delivers a complete perspective of everything you need, with an in-depth analysis of the current and future state of the industry.Galvanic Isolation Market Report Forecast Analysis
| Report Attribute | Details |
|---|---|
| Market Size Value In 2026 | $2.3 billion |
| Revenue Forecast In 2030 | $3.04 billion |
| Growth Rate | CAGR of 7.2% from 2026 to 2030 |
| Base Year For Estimation | 2025 |
| Actual Estimates/Historical Data | 2020-2025 |
| Forecast Period | 2026 - 2030 |
| Market Representation | Revenue in USD Billion and CAGR from 2026 to 2030 |
| Segments Covered | Type, Data Range, Channel, Sales Channel, Application |
| Regional Scope | Asia-Pacific, Western Europe, Eastern Europe, North America, South America, Middle East, Africa |
| Country Scope | The countries covered in the report are Australia, Brazil, China, France, Germany, India, Indonesia, Japan, Taiwan, Russia, South Korea, UK, USA, Canada, Italy, Spain. |
| Key Companies Profiled | Schneider Electric SE, Broadcom Inc, Toshiba Electronic Devices & Storage Corporation, Würth Elektronik, Eaton Corporation, Texas Instruments Incorporated, STMicroelectronics N.V, TDK Corporation, Infineon Technologies AG, Murata Manufacturing Co. Ltd, NXP Semiconductors N.V, Analog Devices Inc, Renesas Electronics Corporation, ROHM Semiconductor, Vishay Intertechnology, Maxim Integrated, Mornsun Power, Silicon Laboratories, Semtech Corporation, Pepperl+Fuchs GmbH, Power Integrations, RECOM Power GmbH, Perle Systems Europe Ltd, Professional Mariner LLC, Traco Electronic AG |
| Customization Scope | Request for Customization |
| Pricing And Purchase Options | Explore Purchase Options |