
Liquefied natural gas Market Report 2026
Global Outlook – By Type (APCI Liquefaction Technology, Cascade Liquefaction Technology, Other Types), By Application (Power Generation, Transportation Fuel, Other Applications), By End User (Utilities And Power Producers, Industrial, Transportation Operators, Residential And Commercial, Marine And Shipping, Other End Users) – Market Size, Trends, Strategies, and Forecast to 2030
Liquefied natural gas Market Overview
• Liquefied natural gas market size has reached to $153.65 billion in 2025 • Expected to grow to $220.22 billion in 2030 at a compound annual growth rate (CAGR) of 7.7% • Growth Driver: Unveiling The Dynamics As Surging Demand Propels Liquefied Natural Gas Market Growth • Market Trend: Increasing Focus On Product Innovations To Provide Reliable Services To Their Customers • Asia-Pacific was the largest region in 2025.Market Gains By 2030 – Top Opportunities By Segment
Market Gain identifies the most promising market opportunities by highlighting the segments or products expected to generate the highest incremental revenue growth over the next five years.
What Is Covered Under Liquefied natural gas Market?
Liquefied Natural Gas (LNG) refers to natural gas that has been cooled to a liquid state at approximately -162°C (-260°F) for ease of storage and transport. It is used to transport natural gas over long distances where pipelines are not feasible, and as a cleaner alternative to other fossil fuels in power generation and heating. LNG can also be utilized as a fuel for vehicles, particularly in heavy-duty and maritime applications. The main liquefied natural gas types are APCI liquefaction technology, cascade liquefaction technology, and others. APCI liquefaction technology refers to multistage propane (C3) precooling system that involves liquefaction employing a nitrogen, methane, ethane, and propane MR system. The various applications are power generation, transportation fuel, and others.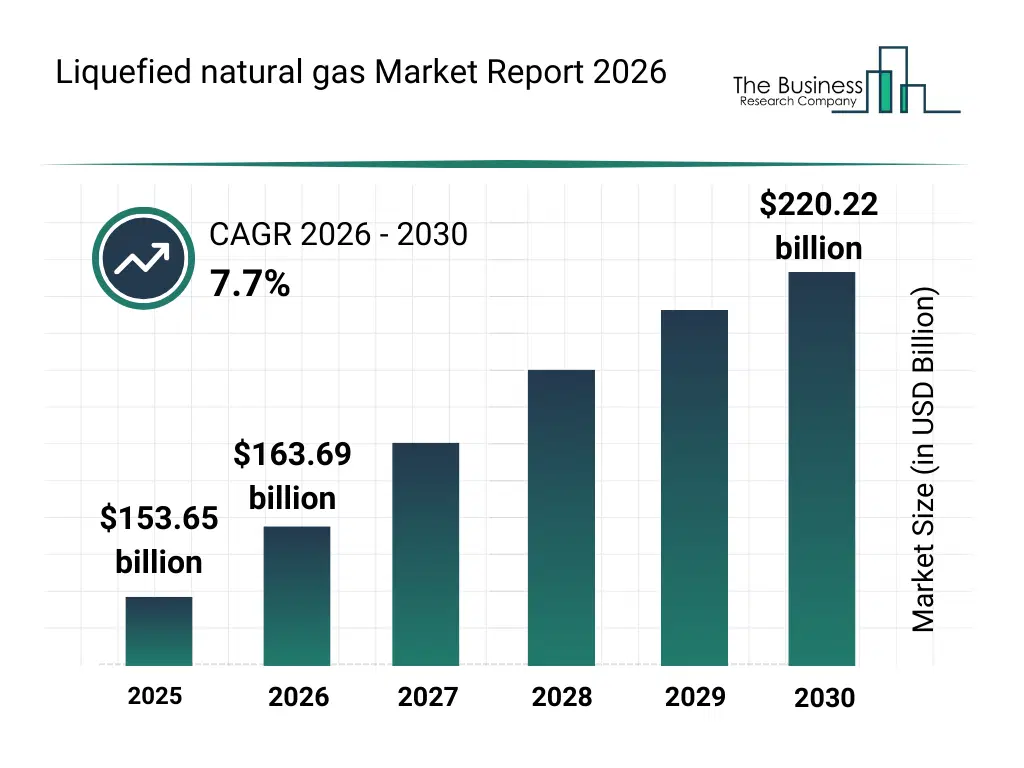
What Is The Liquefied natural gas Market Size and Share 2026?
The liquefied natural gas market size has grown strongly in recent years. It will grow from $153.65 billion in 2025 to $163.69 billion in 2026 at a compound annual growth rate (CAGR) of 6.5%. The growth in the historic period can be attributed to growth in global energy demand, limitations of pipeline infrastructure, expansion of power generation capacity, rise in natural gas production, demand for cleaner fossil fuels.What Is The Liquefied natural gas Market Growth Forecast?
The liquefied natural gas market size is expected to see strong growth in the next few years. It will grow to $220.22 billion in 2030 at a compound annual growth rate (CAGR) of 7.7%. The growth in the forecast period can be attributed to energy transition initiatives, growth in LNG fueled shipping, expansion of gas fired power plants, investment in LNG terminals, rising demand from emerging economies. Major trends in the forecast period include expansion of LNG as a cleaner power fuel, rising adoption in heavy duty transportation, growth in small scale LNG infrastructure, increasing investment in LNG liquefaction projects, rising cross border LNG trade.
Global Liquefied natural gas Market Segmentation
1) By Type: APCI Liquefaction Technology, Cascade Liquefaction Technology, Other Types 2) By Application: Power Generation, Transportation Fuel, Other Applications 3) By End User: Utilities And Power Producers, Industrial, Transportation Operators, Residential And Commercial, Marine And Shipping, Other End Users Subsegments: 1) By APCI Liquefaction Technology: APCI Process (Single Mixed Refrigerant), APCI Process (Dual Mixed Refrigerant) 2) By Cascade Liquefaction Technology: Cascade Process (Conventional), Cascade Process (Modified) 3) By Other Types: Optimized Cascade, Mixed Refrigerant Process, Cryogenic Process The top segments in the liquefied natural gas market will be: • APCI Liquefaction Technology will reach $115.73 Billion by 2030. • Cascade Liquefaction Technology will reach $62.61 Billion by 2030. • Other Liquefaction Technology will reach $41.39 Billion by 2030.What Is The Driver Of The Liquefied natural gas Market?
Rising demand for liquefied natural gas is expected to propel the growth of the liquefied natural gas market going forward. Liquefied natural gas refers to natural gas that is purified and cooled to approximately −260°F, transforming it into a liquid form for easier storage and transportation. The increase in liquefied natural gas demand is driven by growing motor fuel consumption and the expanding semi-urban and rural population, which is boosting overall energy requirements. Rising demand for liquefied natural gas drives the expansion and investment in liquefied natural gas infrastructure and services by creating greater market opportunities, encouraging production efficiency, and supporting global supply chain development. For instance, in June 2025, according to the U.S. Energy Information Administration (EIA), a US-based government organization, natural gas accounted for around 38% of total U.S. energy production in 2024, while natural gas plant liquids contributed about 9%, with NGPL production reaching a record 4 trillion cubic feet, a 7% increase compared to 2023. Therefore, rising demand for liquefied natural gas is driving the growth of the liquefied natural gas industry going forward.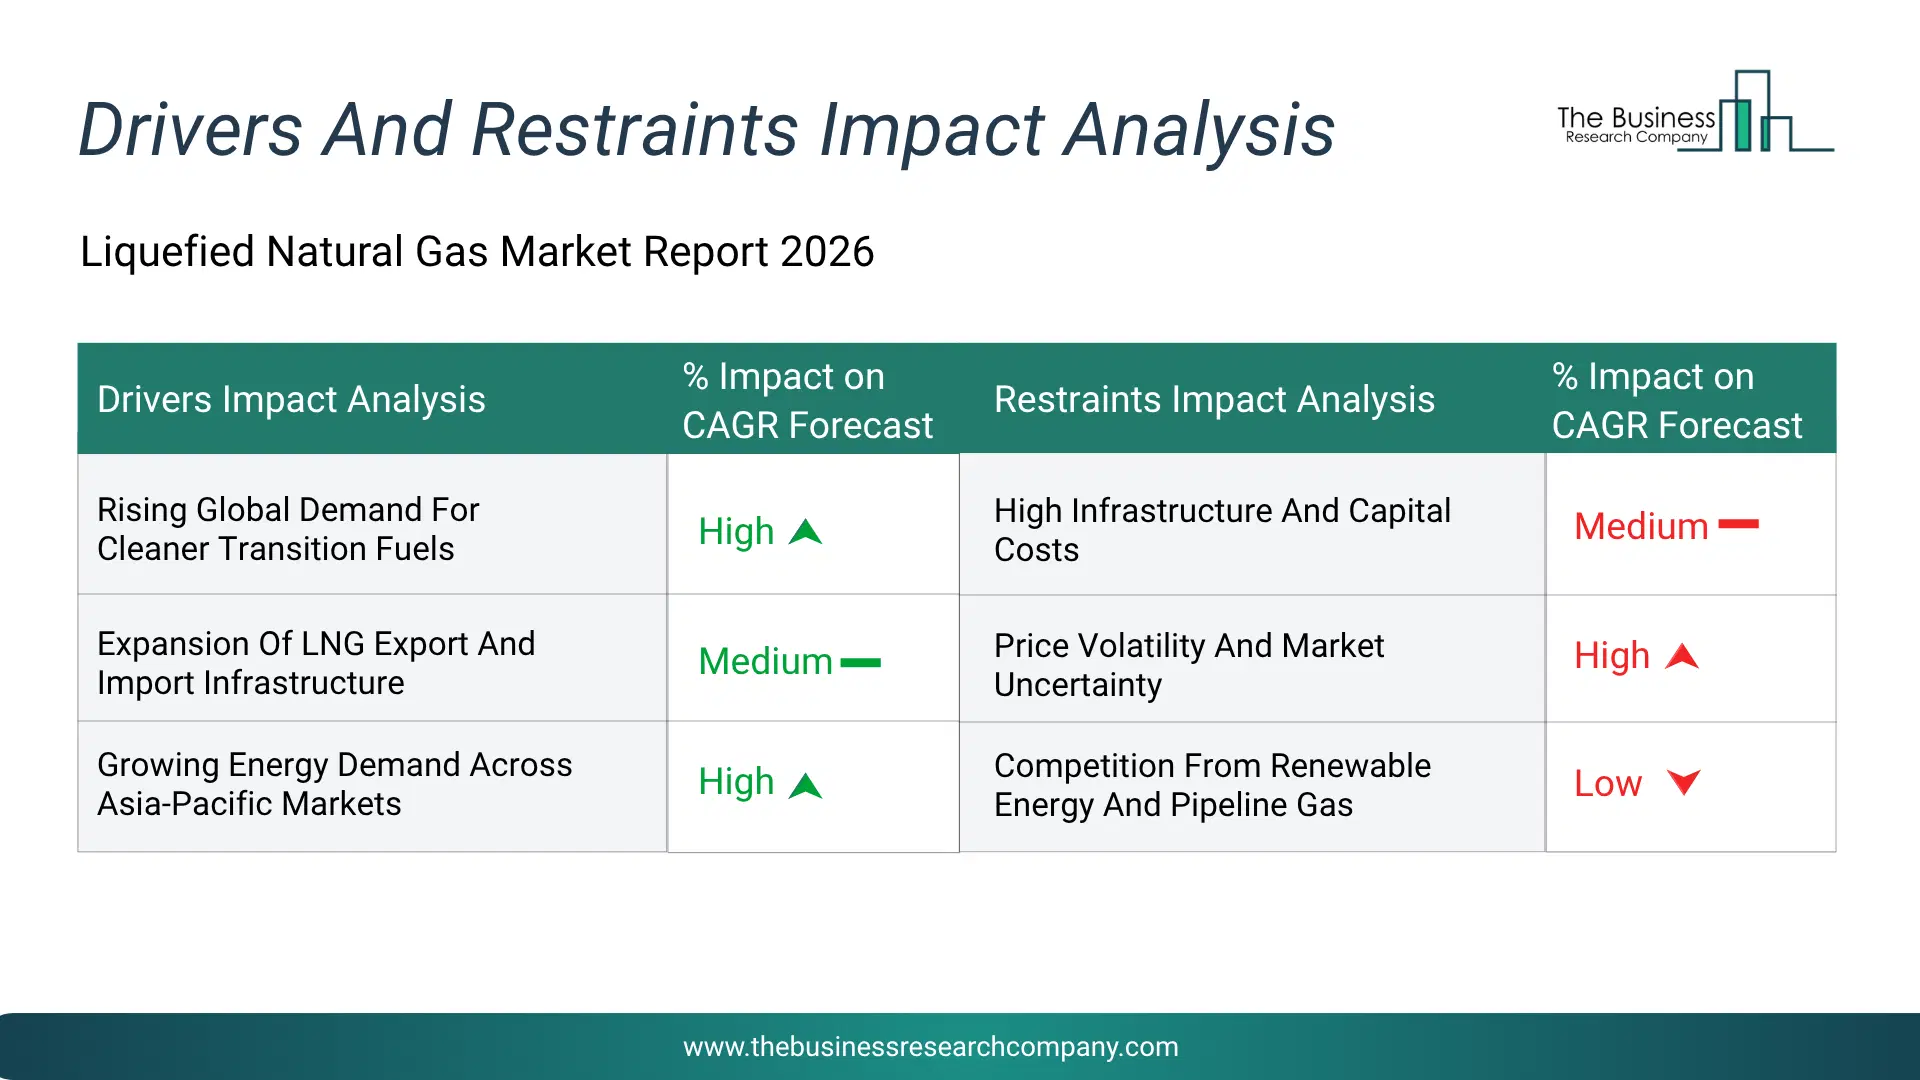
Infographic Chart Showing Key Market Drivers Analysis And Restraints For Liquefied Natural Gas Market
The chart presents an impact analysis of key drivers and restraints, quantifying their relative influence on the market's growth rate and helping assess the balance between growth enablers and limiting factors. This chart offers a high-level perspective; the full report contains more detailed insights.
How Will The Drivers Impact Growth In The Global Liquefied Natural Gas Market?
• Rising Global Demand For Cleaner Transition Fuels (High) – During the forecast period, the rising global demand for cleaner transition fuels is expected to become a key growth driver for the liquefied natural gas market by 2030. Governments and industries are increasingly adopting LNG as a lower-emission alternative to coal and oil in power generation, industrial operations, and transportation applications. LNG offers operational flexibility, lower carbon intensity, and compatibility with existing energy systems, making it an attractive solution during the transition toward cleaner energy sources. Energy-intensive industries are also expanding natural gas utilization to meet environmental objectives while maintaining energy reliability. • Expansion Of LNG Export And Import Infrastructure (Medium) – During the forecast period, the expansion of LNG export and import infrastructure is expected to emerge as a major factor driving the expansion of the liquefied natural gas market by 2030. Significant investments in liquefaction terminals, regasification facilities, storage tanks, and shipping fleets are improving the accessibility and distribution of LNG across international markets. New infrastructure developments are enabling producers to reach additional demand centers while improving supply flexibility and resilience. The growing number of cross-border LNG projects is also strengthening trade connectivity and supporting long-term market development. • Growing Energy Demand Across Asia-Pacific Markets (High) – During the forecast period, the growing energy demand across Asia-Pacific markets is expected to act as a key growth catalyst for the liquefied natural gas market by 2030. Rapid industrialization, urban expansion, and increasing electricity consumption are driving substantial demand for reliable energy supplies across major economies in the region. LNG is increasingly being utilized to support power generation, industrial production, and commercial energy requirements where domestic energy resources are insufficient. Rising investments in gas-based energy systems and broader fuel diversification initiatives are further accelerating LNG adoption.How Will The Restraints Impact Growth In The Global Liquefied Natural Gas Market?
• High Infrastructure And Capital Costs (High) – During the forecast period, the high infrastructure and capital costs are a major restraint for the liquefied natural gas (LNG) market. LNG projects require substantial investment in liquefaction plants, regasification terminals, storage facilities, specialized carriers, and supporting pipeline networks. These large upfront costs create high entry barriers and often involve long development timelines before generating returns. Financing challenges, cost overruns, and regulatory delays can further increase project risk. As a result, high capital requirements can slow new capacity additions and limit market expansion. • Price Volatility And Market Uncertainty (Medium) – During the forecast period, the price volatility and market uncertainty are significant restraints for the liquefied natural gas (LNG) market. LNG prices are highly influenced by geopolitical tensions, seasonal demand shifts, weather conditions, shipping disruptions, and supply-demand imbalances across global markets. Sudden price fluctuations can increase procurement costs for buyers and reduce revenue predictability for producers and traders. Market uncertainty may also delay long-term contracts, investment decisions, and infrastructure development plans. As a result, price instability can create financial risk and slow overall market growth. • Competition From Renewable Energy And Pipeline Gas (High) – During the forecast period, the competition from renewable energy and pipeline gas is a key restraint for the liquefied natural gas (LNG) market. Rapid growth in solar, wind, hydro, and battery storage is providing cleaner and increasingly cost-competitive alternatives for power generation. In regions with established pipeline networks, domestic or imported pipeline gas can also offer lower transportation and supply costs than LNG. Governments and utilities are increasingly prioritizing renewable energy investments to meet long-term decarbonization goals. As a result, rising competition from alternative energy sources can limit LNG demand growth in several markets.Key Players In The Global Liquefied natural gas Market
Major companies operating in the liquefied natural gas market are BP plc, Chevron Corporation, Eni SpA, Exxon Mobil Corporation, TotalEnergies SE, Cheniere Energy Inc., ConocoPhillips Company, Sempra Energy, Woodside Energy Group Ltd., Gazprom Energy, PetroChina Company Limited, Shell plc, Equinor ASA, China Petrochemical Corporation, INPEX Corporation, GAIL India Limited, Indian Oil Corporation Limited, China National Petroleum Corporation, Petronet LNG Ltd., PJSC Gazprom, QatarEnergy, Freeport LNG Development L.P., Kinder Morgan Inc., Tellurian Inc., Venture Global LNG Inc., Apache Corporation, BP Trinidad and Tobago LLC, CNOOC Limited, Devon Energy Corporation, Hess Corporation, JERA Co. Inc., Occidental Petroleum Corporation, Origin Energy Limited, Santos Limited, Woodfibre LNG Limited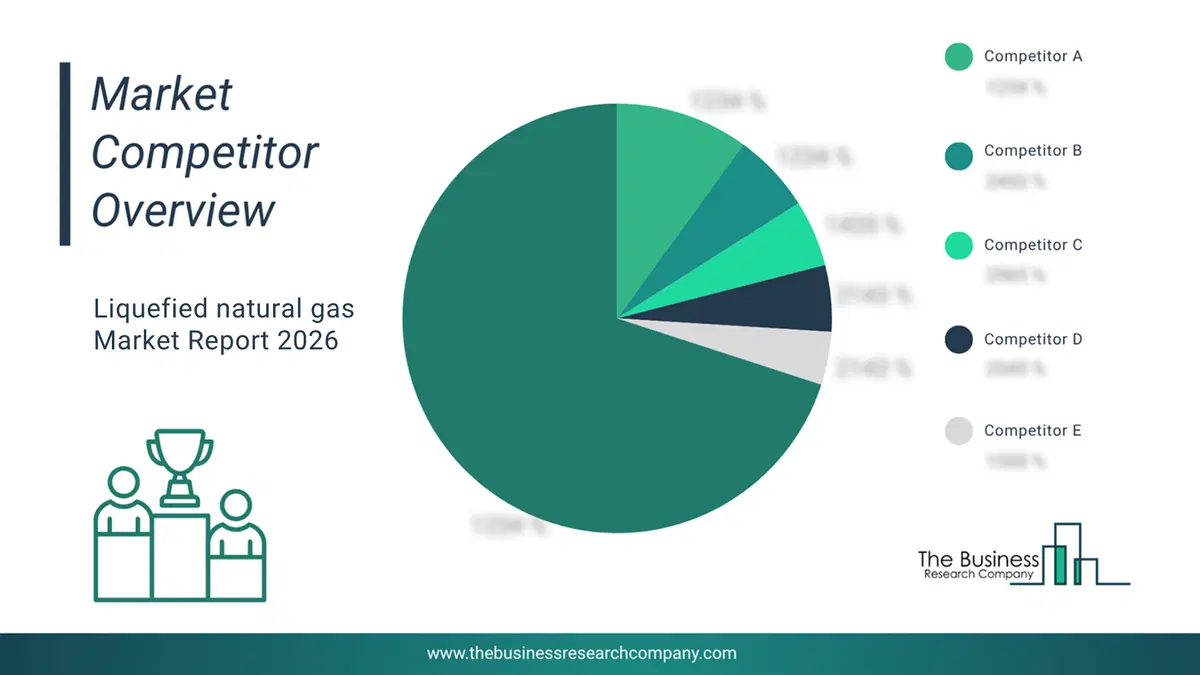
This chart is for illustrative purposes; the full report includes a detailed competitor analysis and comprehensive overview of the top 10 companies in the market.
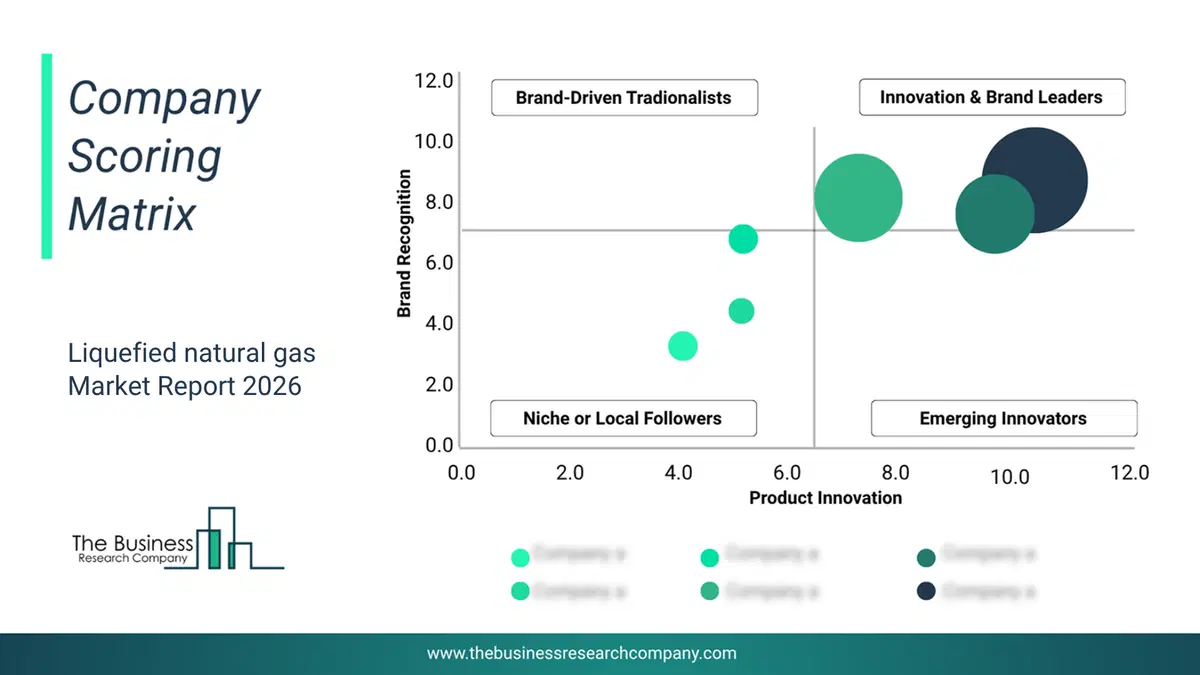
This chart maps companies by product innovation and brand strength, with bubble size indicating relative revenue, helping identify market leaders, challengers, and niche players. This is an illustrative chart; the full report provides a complete and accurate competitive analysis.
Global Liquefied natural gas Market Trends and Insights
Major companies operating in the liquefied natural gas market are focusing on development of innovative products such as SnapLNG to drive revenues in their market. SnapLNG is a new modular and standardized solution for low-carbon and faster time-to-market LNG production. For instance, in September 2023, Technip Energies N.V. a Netherlands-based company that specializes in engineering and technology for the energy industry launched SnapLNG. This pre-engineered and standardized system offers a complete LNG liquefaction plant with streamlined project execution for the decarbonized production of LNG. SnapLNG's innovative design provides previously unheard-of levels of assurance regarding cost execution, supply schedule, plant dependability, and availability. This electrically powered 2.5 Mtpa LNG train solution is made up of repeatable modules that are prepared for delivery and installation.What Are Latest Mergers And Acquisitions In The Liquefied natural gas Market?
In October 2024, Woodside Energy Group Ltd, an Australia-based energy company that supplies energy for homes, industry, and cooling, acquired Tellurian Inc. for an $1.2 billion amount. Through this acquisition, Woodside Energy aims to enhance its position in the U.S. liquefied natural gas (LNG) market and expand its global operations. Tellurian Inc. is a US-based natural gas company that develops low-cost liquefied natural gas (LNG) projects.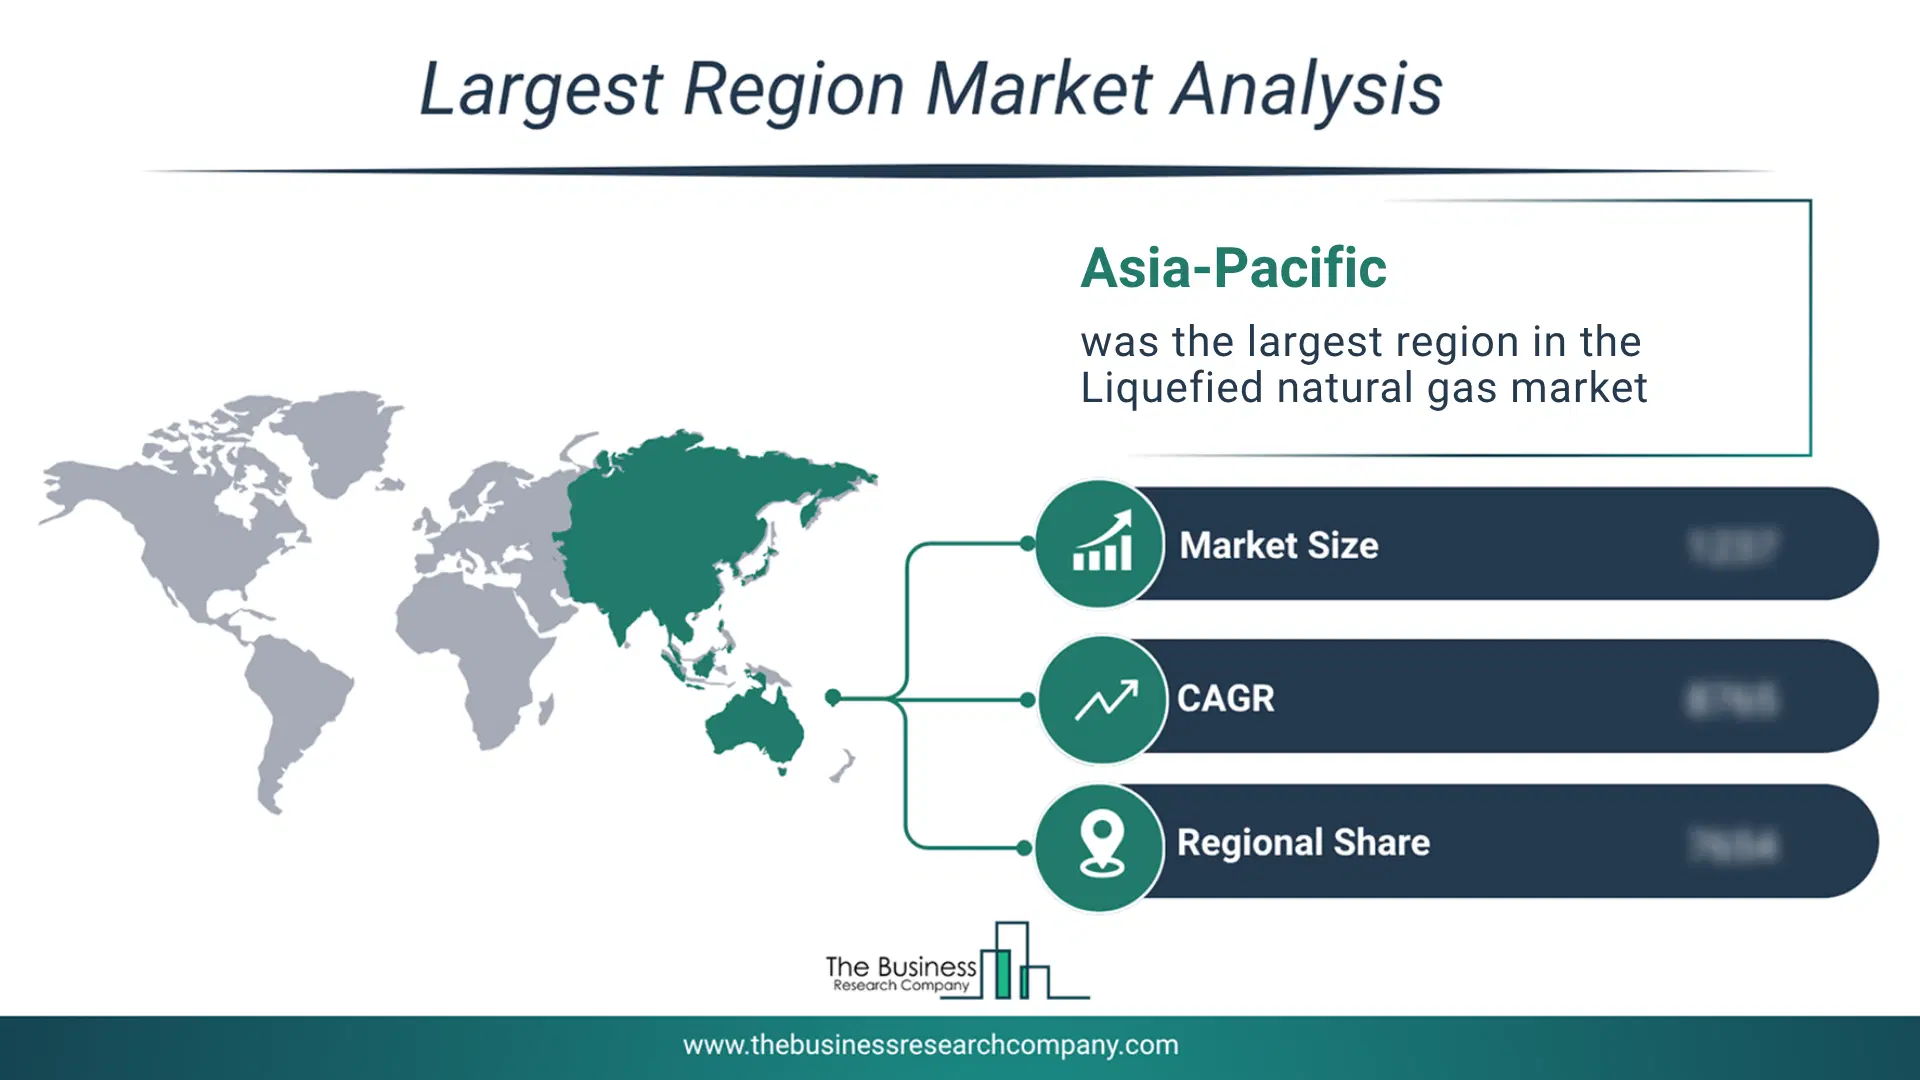
Regional Outlook
Asia-Pacific was the largest region in the liquefied natural gas market in 2025. The regions covered in this market report are Asia-Pacific, South East Asia, Western Europe, Eastern Europe, North America, South America, Middle East, Africa. The countries covered in this market report are Australia, Brazil, China, France, Germany, India, Indonesia, Japan, Taiwan, Russia, South Korea, UK, USA, Canada, Italy, SpainWhat Defines the Liquefied natural gas Market?
The liquefied natural gas market consists of sales of propane, butane, and isobutane. Values in this market are ‘factory gate’ values, that is the value of goods sold by the manufacturers or creators of the goods, whether to other entities (including downstream manufacturers, wholesalers, distributors and retailers) or directly to end customers. The value of goods in this market includes related services sold by the creators of the goods.How is Market Value Defined and Measured?
The market value is defined as the revenues that enterprises gain from the sale of goods and/or services within the specified market and geography through sales, grants, or donations in terms of the currency (in USD unless otherwise specified). The revenues for a specified geography are consumption values that are revenues generated by organizations in the specified geography within the market, irrespective of where they are produced. It does not include revenues from resales along the supply chain, either further along the supply chain or as part of other products.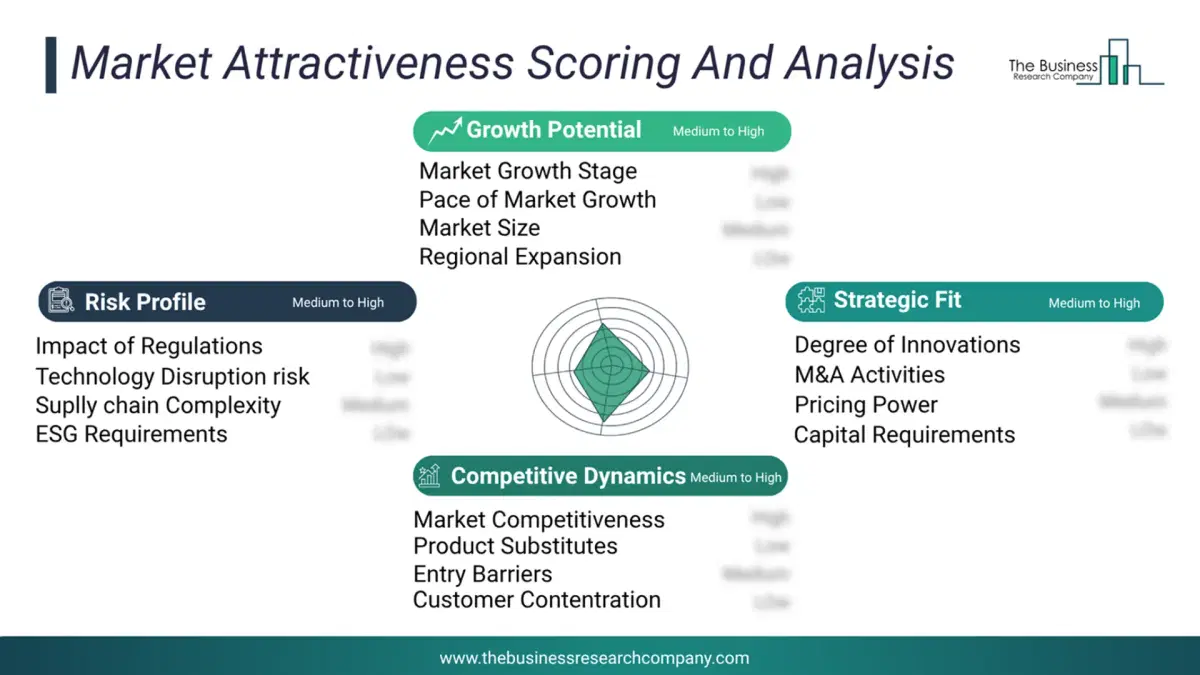
This chart presents market attractiveness based on a quantitative evaluation of growth, competition, strategic alignment, and risk, offering a clear view of opportunity areas for decision-making. This chart is for illustrative purposes; the full report contains the complete analysis.
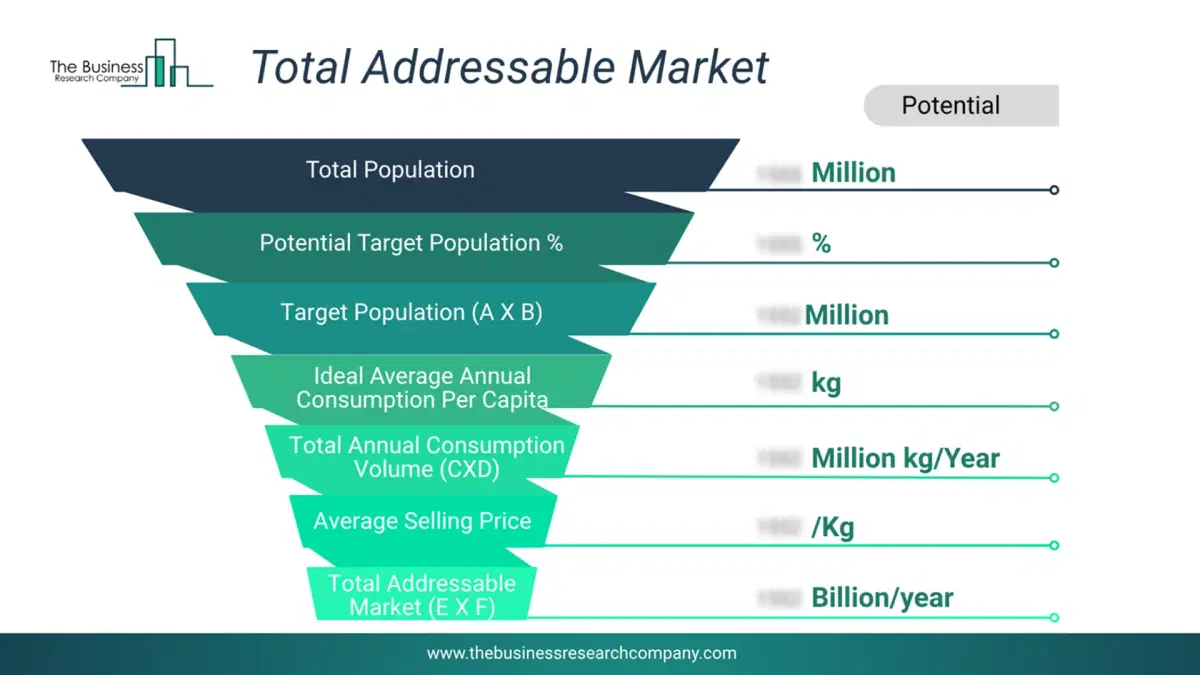
This chart highlights the Total Addressable Market (TAM) by estimating the maximum revenue opportunity using an assumption-driven approach, supporting strategic planning and opportunity sizing across markets. The chart is illustrative; the full report provides a more comprehensive analysis.
What Key Data and Analysis Are Included in the Liquefied natural gas Market Report 2026?
The liquefied natural gas market research report is one of a series of new reports from The Business Research Company that provides market statistics, including industry global market size, regional shares, competitors with the market share, detailed market segments, market trends and opportunities, and any further data you may need to thrive in the liquefied natural gas industry. The market research report delivers a complete perspective of everything you need, with an in-depth analysis of the current and future state of the industry.Liquefied natural gas Market Report Forecast Analysis
| Report Attribute | Details |
|---|---|
| Market Size Value In 2026 | $163.69 billion |
| Revenue Forecast In 2030 | $220.22 billion |
| Growth Rate | CAGR of 7.7% from 2026 to 2030 |
| Base Year For Estimation | 2025 |
| Actual Estimates/Historical Data | 2020-2025 |
| Forecast Period | 2026 - 2030 |
| Market Representation | Revenue in USD Billion and CAGR from 2026 to 2030 |
| Segments Covered | Type, Application, End User |
| Regional Scope | Asia-Pacific, Western Europe, Eastern Europe, North America, South America, Middle East, Africa |
| Country Scope | The countries covered in the report are Australia, Brazil, China, France, Germany, India, Indonesia, Japan, Taiwan, Russia, South Korea, UK, USA, Canada, Italy, Spain. |
| Key Companies Profiled | BP plc, Chevron Corporation, Eni SpA, Exxon Mobil Corporation, TotalEnergies SE, Cheniere Energy Inc., ConocoPhillips Company, Sempra Energy, Woodside Energy Group Ltd., Gazprom Energy, PetroChina Company Limited, Shell plc, Equinor ASA, China Petrochemical Corporation, INPEX Corporation, GAIL India Limited, Indian Oil Corporation Limited, China National Petroleum Corporation, Petronet LNG Ltd., PJSC Gazprom, QatarEnergy, Freeport LNG Development L.P., Kinder Morgan Inc., Tellurian Inc., Venture Global LNG Inc., Apache Corporation, BP Trinidad and Tobago LLC, CNOOC Limited, Devon Energy Corporation, Hess Corporation, JERA Co. Inc., Occidental Petroleum Corporation, Origin Energy Limited, Santos Limited, Woodfibre LNG Limited |
| Customization Scope | Request for Customization |
| Pricing And Purchase Options | Explore Purchase Options |