

Microservices Catalog Market Report 2026
Global Outlook – By Component (Platform, Services ), By Deployment Mode (On-Premises, Cloud ), By Organization Size (Small And Medium Enterprises, Large Enterprises ), By Application (Banking, Financial Services, And Insurance, Healthcare, Retail And E-commerce, Information Technology And Telecommunications, Manufacturing, Other Applications ) – Market Size, Trends, Strategies, and Forecast to 2030
Microservices Catalog Market Overview
• Microservices Catalog market size has reached to $3.1 billion in 2025 • Expected to grow to $10.3 billion in 2030 at a compound annual growth rate (CAGR) of 27.1% • Growth Driver: The Rising Adoption Of Digital Transformation Initiatives Driving The Growth Of The Market Due To Growing Need For Organizations To Improve Operational Efficiency • Market Trend: Advancements In Modular Artificial Intelligence Solutions Accelerate Industry-Specific Application Development • North America was the largest region in 2025 and Asia-Pacific is the fastest growing region.What Is Covered Under Microservices Catalog Market?
A microservices catalog is a centralized repository that documents and organizes all microservices within an application or enterprise, including details such as service functions, application programming interface, ownership, dependencies, versions, and deployment status. It enables developers, architects, and operations teams to efficiently discover, manage, govern, and reuse microservices, improving visibility, collaboration, and overall system maintenance. The main components of microservices catalogs include platforms and services. Platforms refer to software solutions that provide centralized repositories for discovering, documenting, organizing, and managing microservices across an organization’s application environment. These solutions are deployed through on-premises and cloud models. They are adopted by small and medium enterprises and large enterprises and the various applications involved are banking, financial services, and insurance, healthcare, retail and e-commerce, information technology and telecommunications, manufacturing, and others.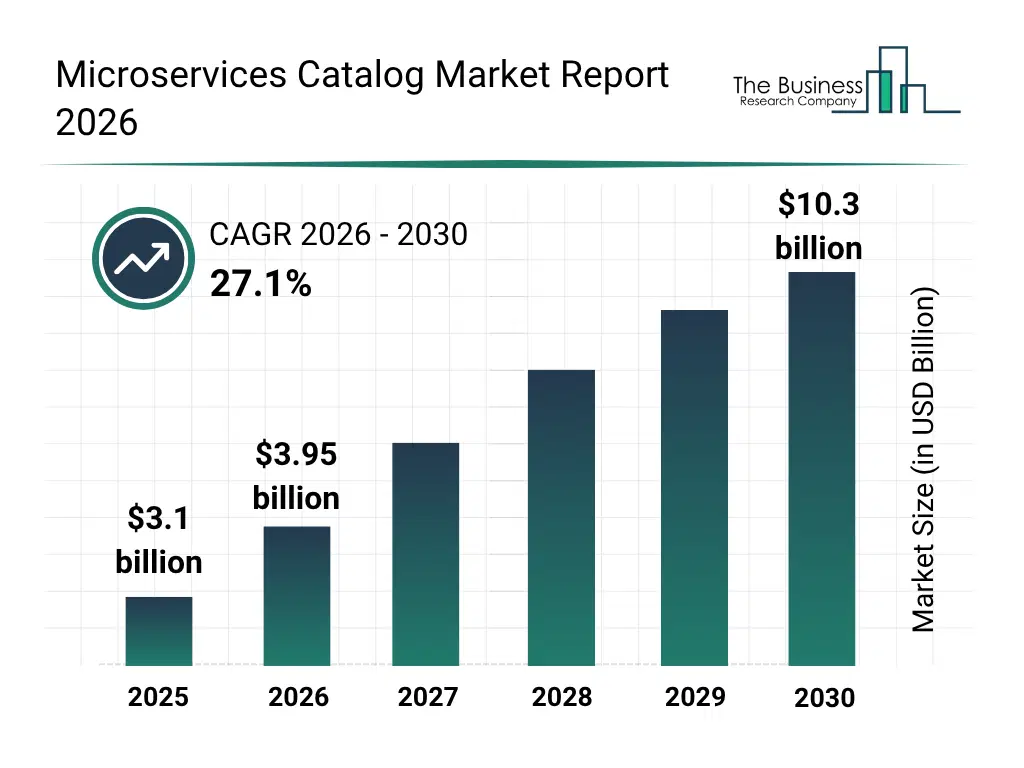
What Is The Microservices Catalog Market Size and Share 2026?
The microservices catalog market size has grown exponentially in recent years. It will grow from $3.1 billion in 2025 to $3.95 billion in 2026 at a compound annual growth rate (CAGR) of 27.5%. The growth in the historic period can be attributed to growing adoption of microservices architecture, increasing complexity of distributed applications, rising demand for centralized service visibility, expansion of API-based application development, growing need for efficient microservices management.What Is The Microservices Catalog Market Growth Forecast?
The microservices catalog market size is expected to see exponential growth in the next few years. It will grow to $10.3 billion in 2030 at a compound annual growth rate (CAGR) of 27.1%. The growth in the forecast period can be attributed to increasing adoption of cloud-native application development, rising demand for automated service discovery, growing need for microservices governance, increasing deployment of distributed applications, rising demand for service dependency management. Major trends in the forecast period include increasing adoption of centralized microservices discovery and cataloging, growing integration of api metadata and dependency mapping, rising adoption of automated microservices inventory management, increasing emphasis on microservices ownership and version tracking, growing use of service catalog governance and lifecycle management.
Global Microservices Catalog Market Segmentation
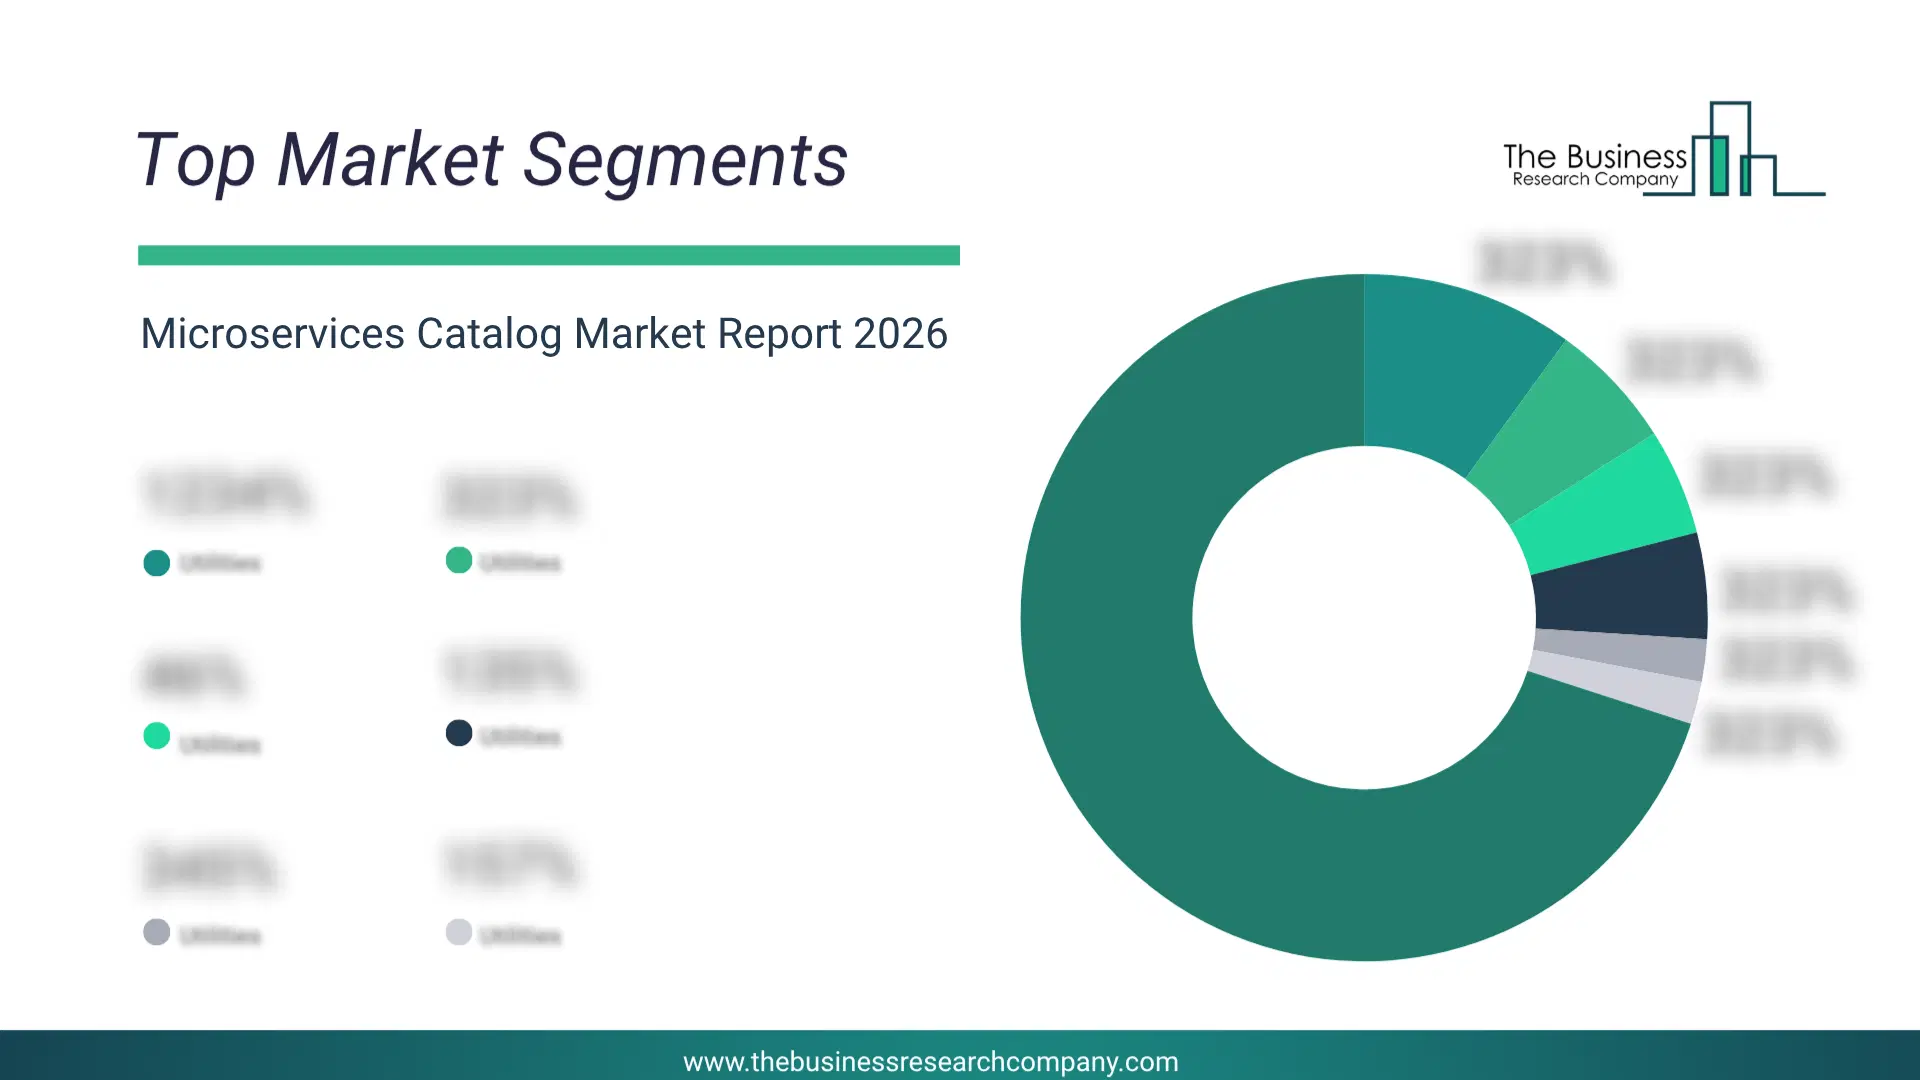
1) By Component: Platform, Services 2) By Deployment Mode: On-Premises, Cloud 3) By Organization Size: Small And Medium Enterprises, Large Enterprises 4) By Application: Banking, Financial Services, And Insurance, Healthcare, Retail And E-commerce, Information Technology And Telecommunications, Manufacturing, Other Applications Subsegments: 1) By Platform: Service Registry, Application Programming Interface Gateway, Configuration Management, Service Discovery, Catalog Management, Access Control, Monitoring And Analytics, Workflow Automation 2) By Services: Consulting Services, Integration Services, Deployment Services, Migration Services, Customization Services, Training Services, Support And Maintenance Services, Managed ServicesWhat Is The Driver Of The Microservices Catalog Market?
The rising adoption of digital transformation initiatives is expected to propel the growth of the microservices catalog market going forward. Digital transformation initiatives refer to strategic efforts undertaken by organizations to integrate digital technologies, such as cloud computing, artificial intelligence, automation, and data analytics, into their operations to improve efficiency, enhance customer experiences, and create new business models. Rising adoption of digital transformation initiatives is due to the growing need for organizations to improve operational efficiency by automating processes, optimizing resource utilization, reducing operational costs, and enabling faster data-driven decision-making. The adoption of digital transformation initiatives benefits microservices catalogs by increasing the need for centralized service discovery, management, and governance across distributed application environments. For instance, in November 2023, according to the Central Digital and Data Office (CDDO), a UK-based government agency, from April 2022 to April 2023, the Government Digital and Data profession expanded its workforce by 19%, enhancing essential digital skills across the civil service. During the same period, 32 organizations implemented the common Government Digital and Data pay framework, reducing dependence on contractors and generating savings for taxpayers. Therefore, the rising adoption of digital transformation initiatives is driving the growth of the microservices catalog industry.Key Players In The Global Microservices Catalog Market
Major companies operating in the microservices catalog market are Microsoft Corporation, Google LLC, International Business Machines Corporation, Oracle Corporation, Broadcom Inc., ServiceNow Inc., Atlassian Corporation, Postman Inc., Kong Inc., Spotify Technology S.A., Solo.io Inc., Axway Software SA, Humanitec GmbH, Port.io Ltd., Cortex Applications Inc., OpsLevel Inc., Gravitee.io SAS, Tyk Technologies Ltd., Mia-Platform S.r.l., Tetrate.io Inc.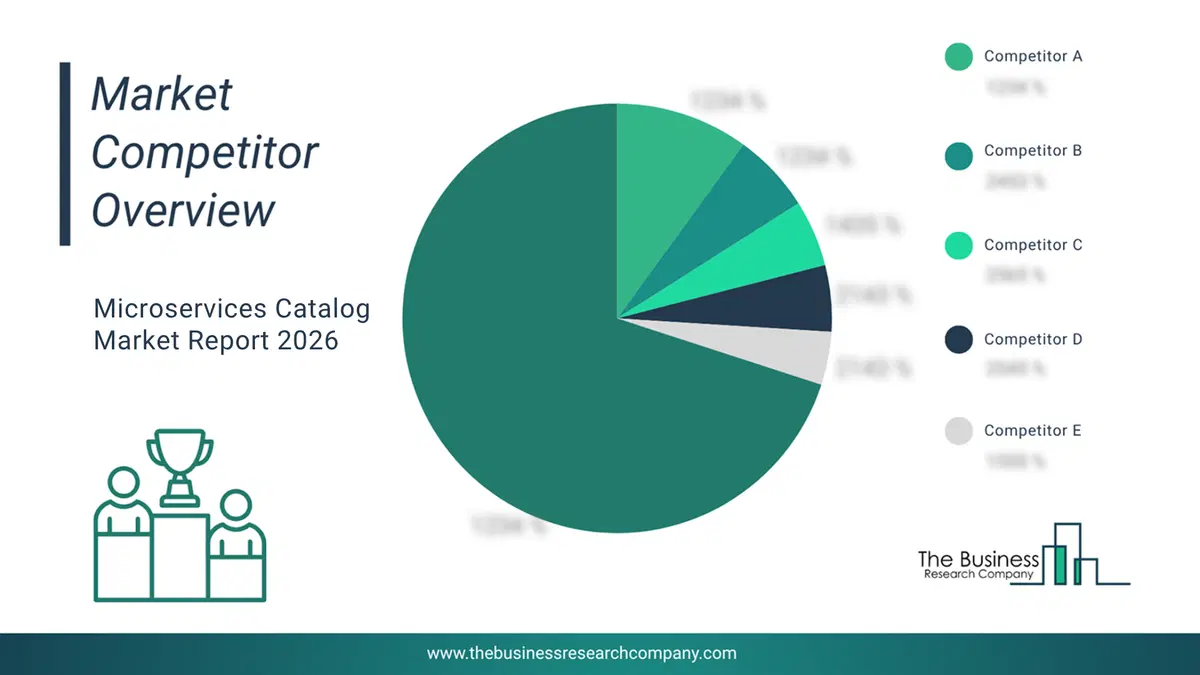
This chart is for illustrative purposes; the full report includes a detailed competitor analysis and comprehensive overview of the top 10 companies in the market.
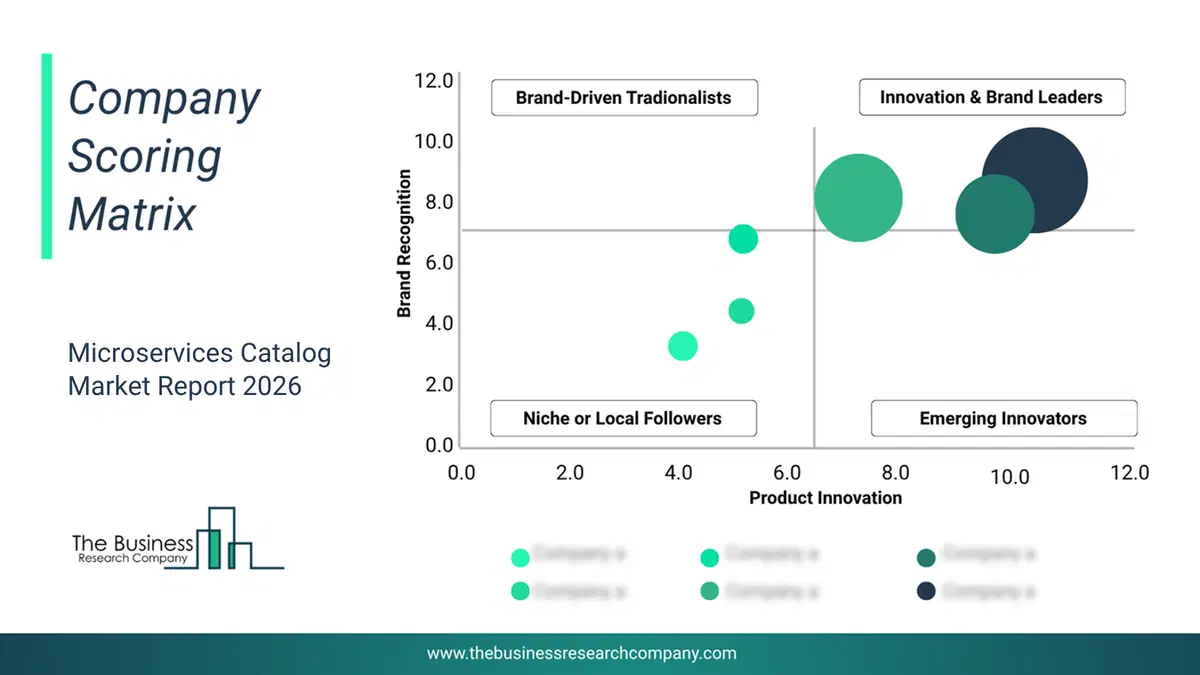
This chart maps companies by product innovation and brand strength, with bubble size indicating relative revenue, helping identify market leaders, challengers, and niche players. This is an illustrative chart; the full report provides a complete and accurate competitive analysis.
Global Microservices Catalog Market Trends and Insights
Major companies operating in the microservices catalog market are focusing on developing innovative solutions, such as generative artificial intelligence microservices, to enable faster AI application development, streamline deployment, and provide reusable artificial intelligence capabilities through APIs across industries. Generative Artificial intelligence microservices are modular, reusable AI components that provide specific generative artificial intelligence capabilities, such as text generation, image creation, speech processing, or data analysis, through standardized APIs for easy integration into applications. For instance, in March 2024, NVIDIA Corporation, a US-based technology company, launched a new catalog or suite of healthcare-focused generative AI microservices that includes NVIDIA NIM AI models and GPU-accelerated microservices for biology, chemistry, medical imaging, genomics, and healthcare data workflows. The launch enables healthcare organizations and developers to build and deploy AI-powered applications faster by using pre-built, optimized microservices accessible through standardized APIs. These microservices help accelerate drug discovery, enhance medical research, improve clinical workflows, and support the development of digital health solutions.What Are Latest Mergers And Acquisitions In The Microservices Catalog Market?
In November 2023, SAP SE, a Germany-based software corporation, acquired LeanIX GmbH for an undisclosed amount. With this acquisition, SAP aims to expand its business transformation portfolio by integrating LeanIX’s enterprise architecture management capabilities to provide customers with a comprehensive transformation suite, enable AI-driven process optimization, and improve visibility and management of complex IT landscapes. LeanIX GmbH is a Germany-based company that provides a microservices catalog capability as part of its enterprise architecture management (EAM) platform.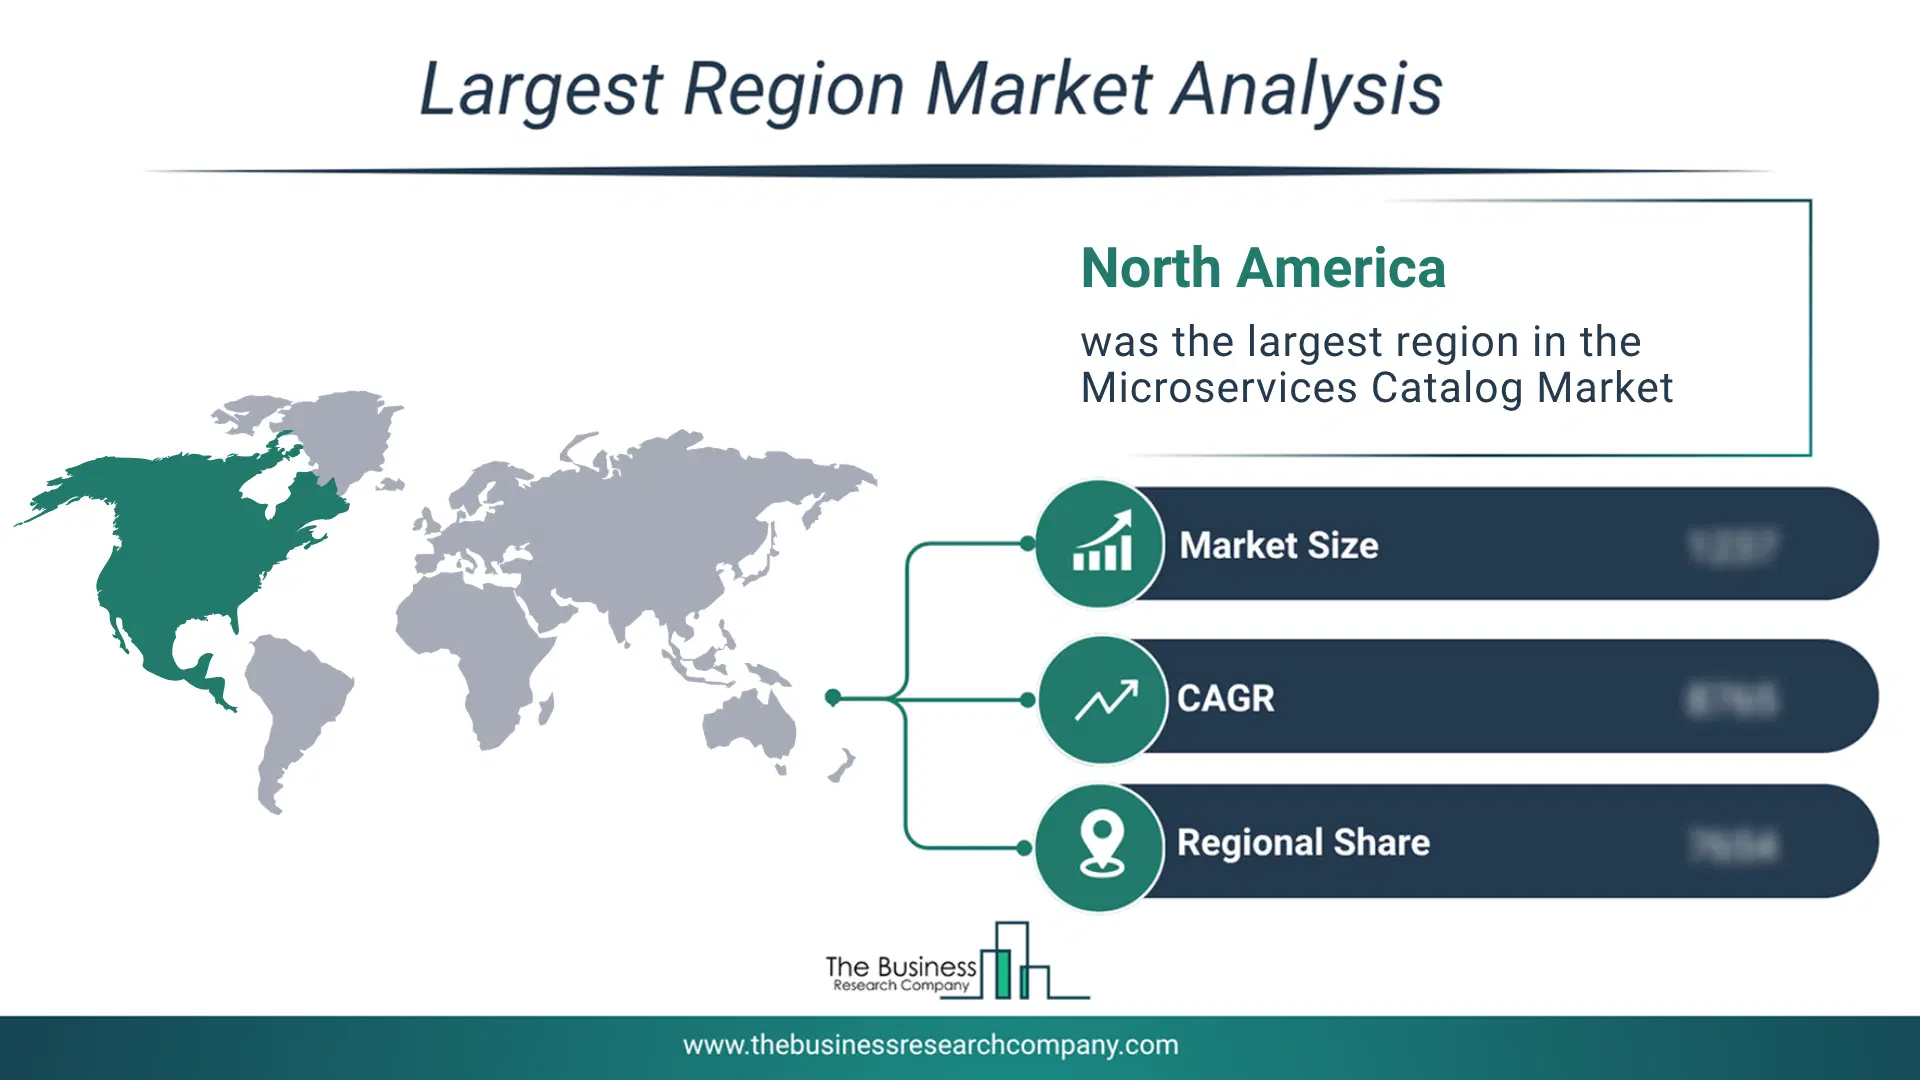
Regional Insights
North America was the largest region in the microservices catalog market in 2025. Asia-Pacific is expected to be the fastest-growing region in the forecast period. The regions covered in this market report are Asia-Pacific, South East Asia, Western Europe, Eastern Europe, North America, South America, Middle East, Africa. The countries covered in this market report are Australia, Brazil, China, France, Germany, India, Indonesia, Japan, Taiwan, Russia, South Korea, UK, USA, Canada, Italy, Spain.What Defines the Microservices Catalog Market?
The microservices catalog market includes revenues earned by entities by providing services such as microservices discovery and registration service, service governance and policy management service, service lifecycle management service, and observability and dependency mapping services. The market value includes the value of related goods sold by the service provider or included within the service offering. Only goods and services traded between entities or sold to end consumers are included.How is Market Value Defined and Measured?
The market value is defined as the revenues that enterprises gain from the sale of goods and/or services within the specified market and geography through sales, grants, or donations in terms of the currency (in USD unless otherwise specified). The revenues for a specified geography are consumption values that are revenues generated by organizations in the specified geography within the market, irrespective of where they are produced. It does not include revenues from resales along the supply chain, either further along the supply chain or as part of other products.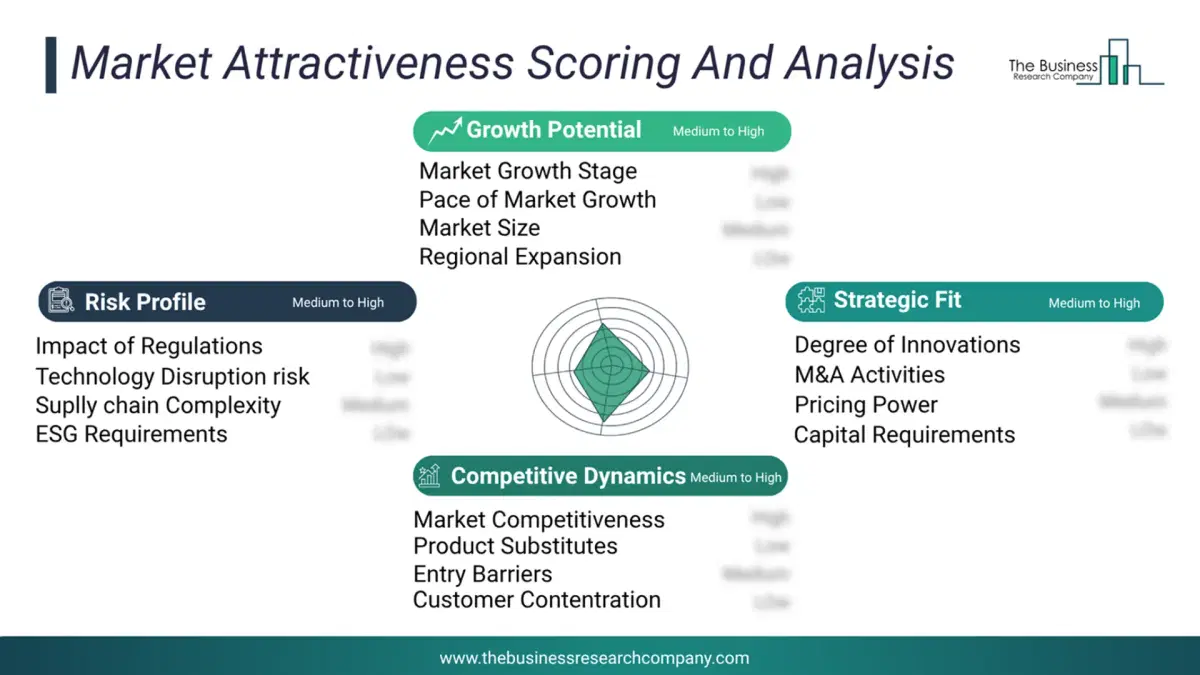
This chart presents market attractiveness based on a quantitative evaluation of growth, competition, strategic alignment, and risk, offering a clear view of opportunity areas for decision-making. This chart is for illustrative purposes; the full report contains the complete analysis.
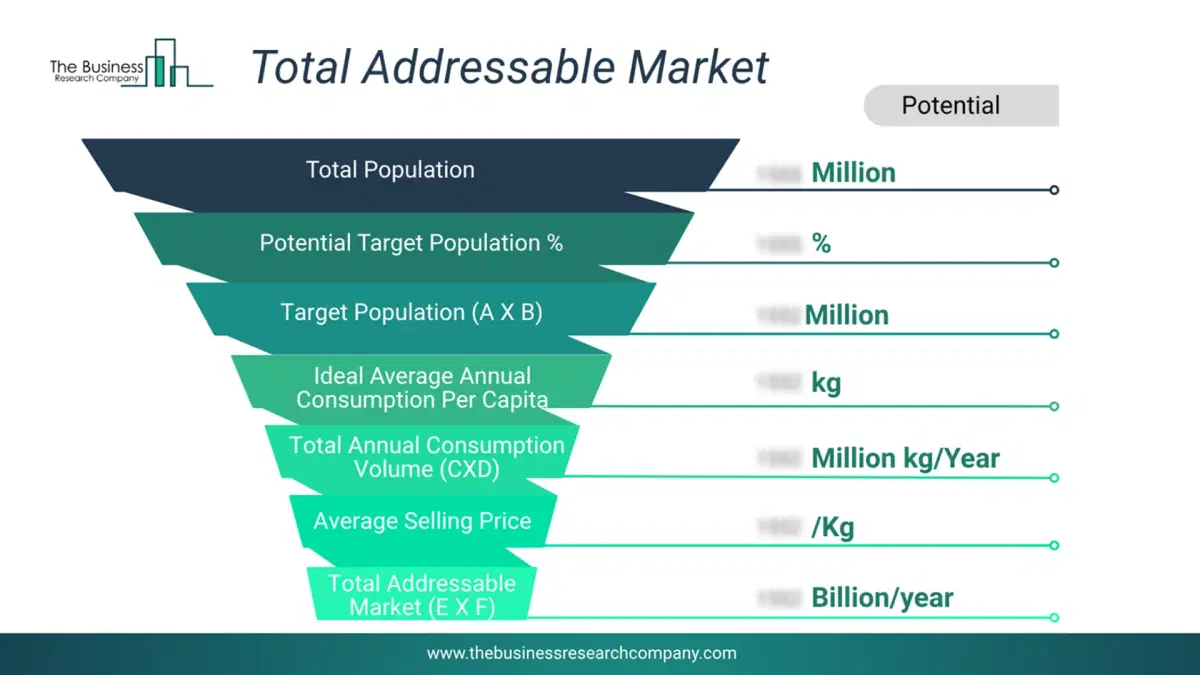
This chart highlights the Total Addressable Market (TAM) by estimating the maximum revenue opportunity using an assumption-driven approach, supporting strategic planning and opportunity sizing across markets. The chart is illustrative; the full report provides a more comprehensive analysis.
What Key Data and Analysis Are Included in the Microservices Catalog Market Report 2026?
The microservices catalog market research report is one of a series of new reports from The Business Research Company that provides market statistics, including industry global market size, regional shares, competitors with the market share, detailed market segments, market trends and opportunities, and any further data you may need to thrive in the microservices catalog industry. The market research report delivers a complete perspective of everything you need, with an in-depth analysis of the current and future state of the industry.Microservices Catalog Market Report Forecast Analysis
| Report Attribute | Details |
|---|---|
| Market Size Value In 2026 | $3.95 billion |
| Revenue Forecast In 2030 | $10.3 billion |
| Growth Rate | CAGR of 27.1% from 2026 to 2030 |
| Base Year For Estimation | 2025 |
| Actual Estimates/Historical Data | 2020-2025 |
| Forecast Period | 2026 - 2030 |
| Market Representation | Revenue in USD Billion and CAGR from 2026 to 2030 |
| Segments Covered | Component, Deployment Mode, Organization Size, Application |
| Regional Scope | Asia-Pacific, Western Europe, Eastern Europe, North America, South America, Middle East, Africa |
| Country Scope | The countries covered in the report are Australia, Brazil, China, France, Germany, India, Indonesia, Japan, Taiwan, Russia, South Korea, UK, USA, Canada, Italy, Spain. |
| Key Companies Profiled | Microsoft Corporation, Google LLC, International Business Machines Corporation, Oracle Corporation, Broadcom Inc., ServiceNow Inc., Atlassian Corporation, Postman Inc., Kong Inc., Spotify Technology S.A., Solo.io Inc., Axway Software SA, Humanitec GmbH, Port.io Ltd., Cortex Applications Inc., OpsLevel Inc., Gravitee.io SAS, Tyk Technologies Ltd., Mia-Platform S.r.l., Tetrate.io Inc. |
| Customization Scope | Request for Customization |
| Pricing And Purchase Options | Explore Purchase Options |