

Narvar Returns Portal Market Report 2026
Global Outlook – By Component (Software, Services), By Deployment Mode (Cloud Based, On-Premises), By Enterprise Size (Small And Medium Enterprises, Large Enterprises), By Sales Channel (Direct To Consumer Brands, Online Marketplaces, Omnichannel Retailers, Brick And Mortar Retailers), By End User (Retail, Electronic Commerce, Logistics, Other End Users) – Market Size, Trends, Strategies, and Forecast to 2030
Narvar Returns Portal Market Overview
• Narvar Returns Portal market size has reached to $1.38 billion in 2025 • Expected to grow to $2.84 billion in 2030 at a compound annual growth rate (CAGR) of 15.4% • Growth Driver: The Rising E-Commerce Return Volumes Driving The Growth Of The Market Due To Inconsistent Or Inaccurate Product Descriptions And Sizing Information • Market Trend: AI-Powered Returns Management And Fraud Detection Platform Enhances Post-Purchase Efficiency And Reduces Return Losses • North America was the largest region in 2025 and Asia-Pacific is the fastest growing region.What Is Covered Under Narvar Returns Portal Market?
Narvar returns portal is a branded post-purchase platform that allows customers to initiate, track, and manage product returns, exchanges, and refunds in a self-service digital interface. It streamlines the reverse logistics process for retailers by automating return authorization, providing shipping options, and improving visibility across the returns lifecycle. The main components of narvar returns portal include software and services. Software refers to digital return management solutions that automate return requests, track return status, streamline reverse logistics, and enhance the post-purchase customer experience for retailers. These solutions are deployed through cloud based and On-Premises environments and are adopted by small and medium enterprises as well as large enterprises. They are used across direct to consumer brands, online marketplaces, omnichannel retailers, and brick and mortar retailers and are utilized by end users including retail, electronic commerce, logistics, and others.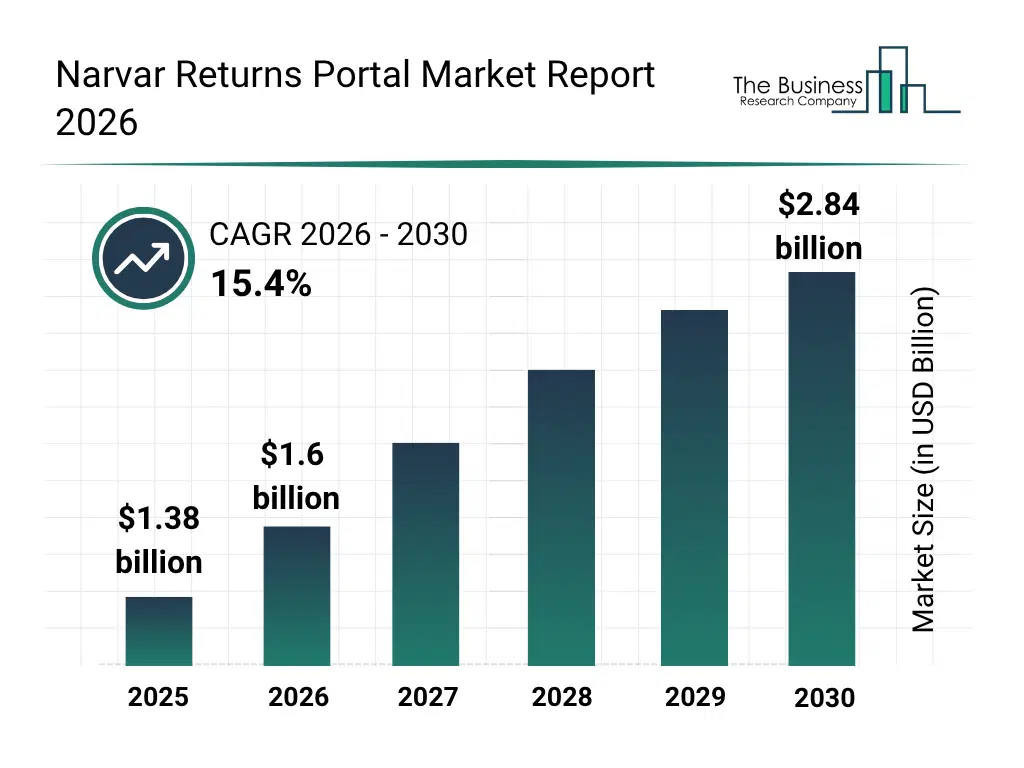
What Is The Narvar Returns Portal Market Size and Share 2026?
The narvar returns portal market size has grown rapidly in recent years. It will grow from $1.38 billion in 2025 to $1.6 billion in 2026 at a compound annual growth rate (CAGR) of 15.8%. The growth in the historic period can be attributed to increasing e commerce adoption, rising online retail transactions, growing demand for simplified return processes, increasing customer expectations for flexible return options, expanding digital transformation among retailers.What Is The Narvar Returns Portal Market Growth Forecast?
The narvar returns portal market size is expected to see rapid growth in the next few years. It will grow to $2.84 billion in 2030 at a compound annual growth rate (CAGR) of 15.4%. The growth in the forecast period can be attributed to increasing demand for automated reverse logistics solutions, rising adoption of personalized customer experience platforms, growing need for efficient refund and exchange management, increasing implementation of cloud based returns platforms, expanding adoption among omnichannel retailers. Major trends in the forecast period include increasing adoption of automated returns management solutions, growing demand for seamless customer return experiences, rising integration of omnichannel returns capabilities, increasing focus on reverse logistics optimization, growing preference for self service return portals.
Global Narvar Returns Portal Market Segmentation
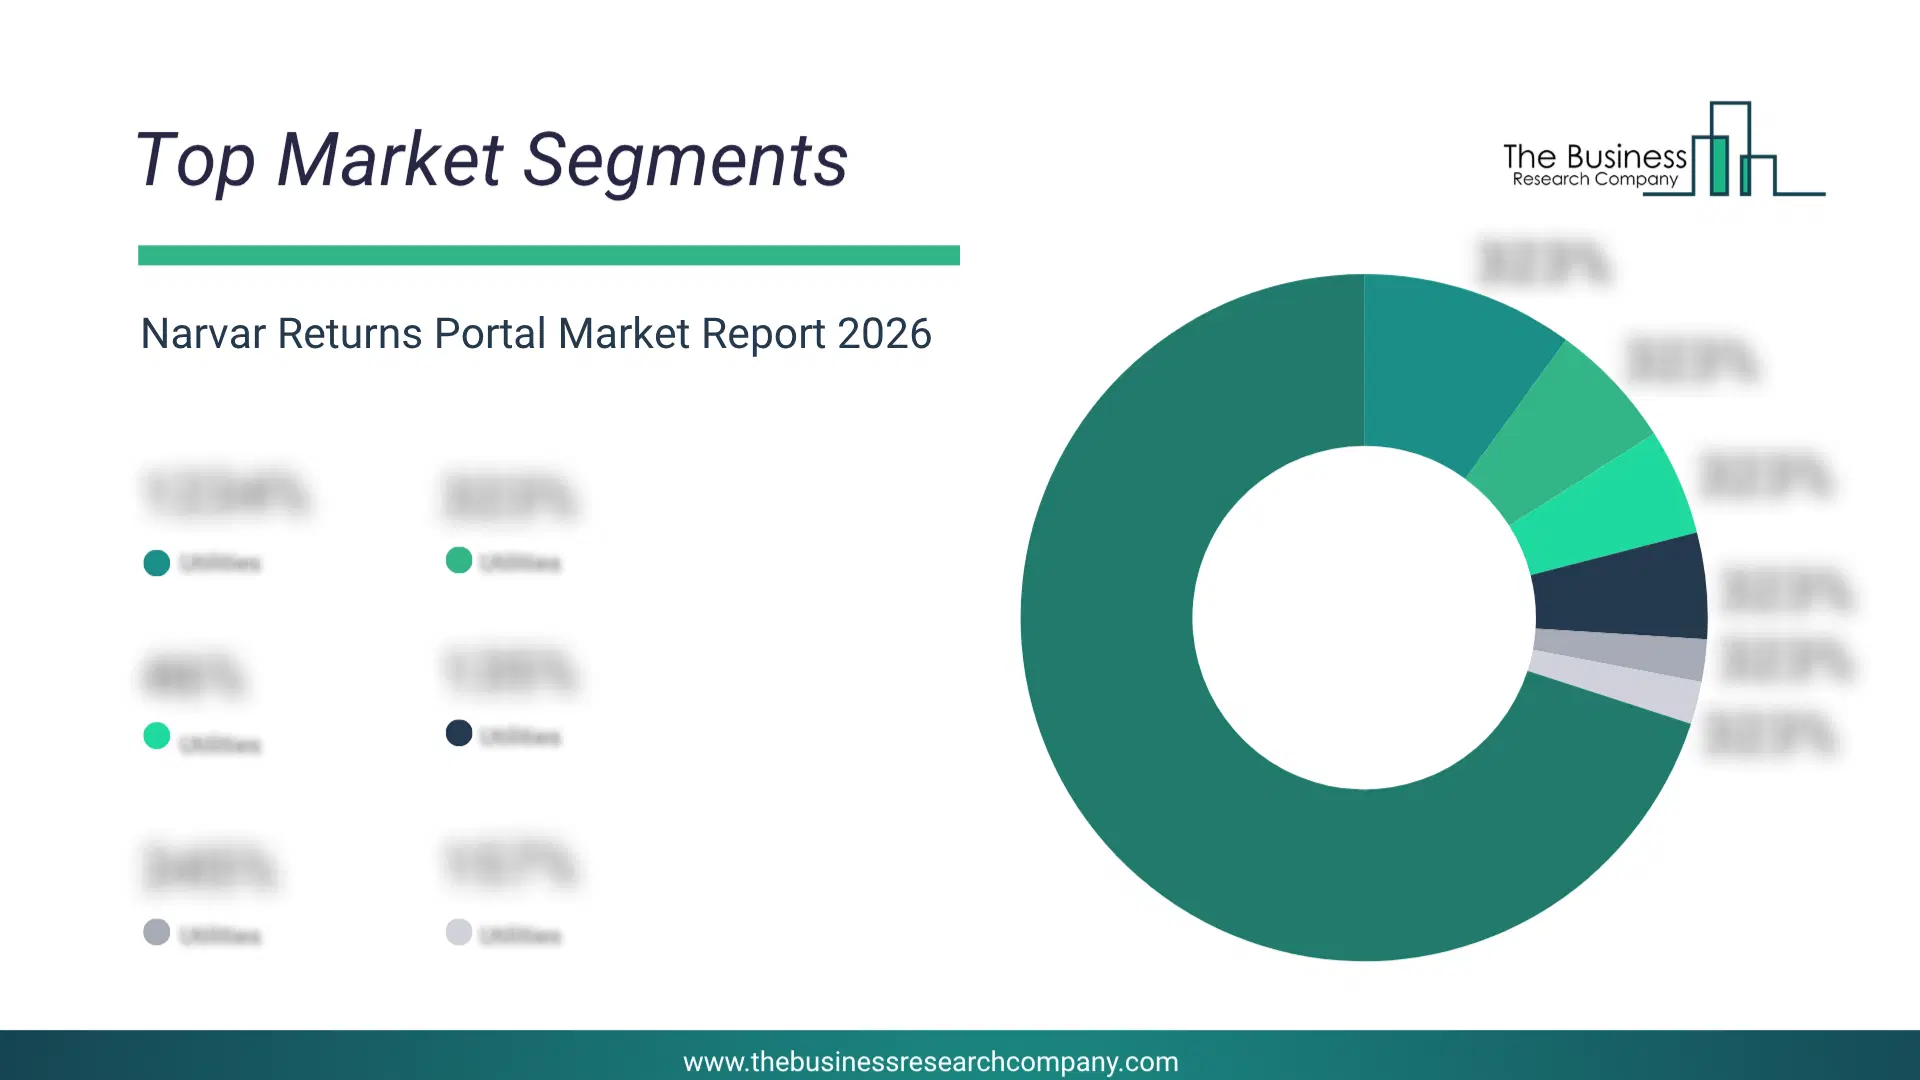
1) By Component: Software, Services 2) By Deployment Mode: Cloud Based, On-Premises 3) By Enterprise Size: Small And Medium Enterprises, Large Enterprises 4) By Sales Channel: Direct To Consumer Brands, Online Marketplaces, Omnichannel Retailers, Brick And Mortar Retailers 5) By End User: Retail, Electronic Commerce, Logistics, Other End Users Subsegments: 1) By Software: Returns Management Platform, Order Tracking And Visibility Software, Automated Refund Processing Systems, Customer Communication And Notification Tools, Analytics And Reporting Dashboards, Fraud Detection And Prevention Modules 2) By Services: Implementation And Integration Services, Consulting And Strategy Services, Technical Support And Maintenance Services, Managed Returns Operations Services, Training And Onboarding Services, Customer Experience Optimization ServicesWhat Are The Drivers Of The Narvar Returns Portal Market?
The rising e-commerce return volume is expected to propel the growth of the narvar returns portal market going forward. An e-commerce return refers to the process in which a customer sends back a purchased product to an online retailer after delivery, typically for reasons such as damage, defects, wrong item, or change of mind, in exchange for a refund, replacement, or store credit. Rising e-commerce return volumes are primarily driven by inconsistent or inaccurate product descriptions and sizing information, which lead customers to receive items that do not match their expectations, resulting in higher return rates. Narvar returns portal streamlines e-commerce returns by automating the end-to-end return process, enabling smooth return initiation, real-time tracking, and optimized reverse logistics while reducing operational complexity and enhancing customer experience. For instance, in January 2024, according to PUDO Inc., a US-based logistics company, the proportion of returned e-commerce goods increased from about 20% in 2022 to roughly 25% in 2023. Therefore, the rising e-commerce return volume is driving the growth of the narvar returns portal industry. The rise of direct-to-consumer brands is expected to propel the growth of the narvar returns portal market going forward. Direct-to-consumer (D2C) brands refer to companies that sell their products directly to customers through their own online platforms or retail channels without relying on traditional intermediaries such as wholesalers, distributors, or third-party retailers. The rise of direct-to-consumer (D2C) brands is due to the expansion of e-commerce platforms, which enable brands to reach customers directly, reduce dependency on intermediaries, lower costs, and offer more personalised and data-driven shopping experiences. The rise of direct-to-consumer (D2C) brands strengthens the demand for the narvar returns portal, as these brands rely on streamlined, digital-first post-purchase experiences to efficiently manage returns, enhance customer satisfaction, and retain control over the entire customer journey. For instance, November 2024, according to Omnia Retail B.V., a Netherlands-based software company, in the United States, D2C shoppers are projected to reach about 111 million in 2023, representing roughly 40% of the population. Therefore, the rise of direct-to-consumer brands is driving the growth of the Narvar returns portal industry.Key Players In The Global Narvar Returns Portal Market
Major companies operating in the narvar returns portal market are United Parcel Service Inc., Oracle Corporation, Shopify Inc., Blue Yonder Inc., Global-e Online Ltd., ShipBob Inc., nShift AB, AfterShip Ltd., Sendcloud B.V., Shippo Inc., Narvar Inc., Auctane Inc., Easyship Global Ltd., Xariable Inc., parcelLab Inc., Redo Tech Inc., ReturnGO Ltd., ReturnLogic Inc., ShippyPro S.r.l., Refundid Pty Ltd, Claimlane ApS, ClickPost Logistics Private Limited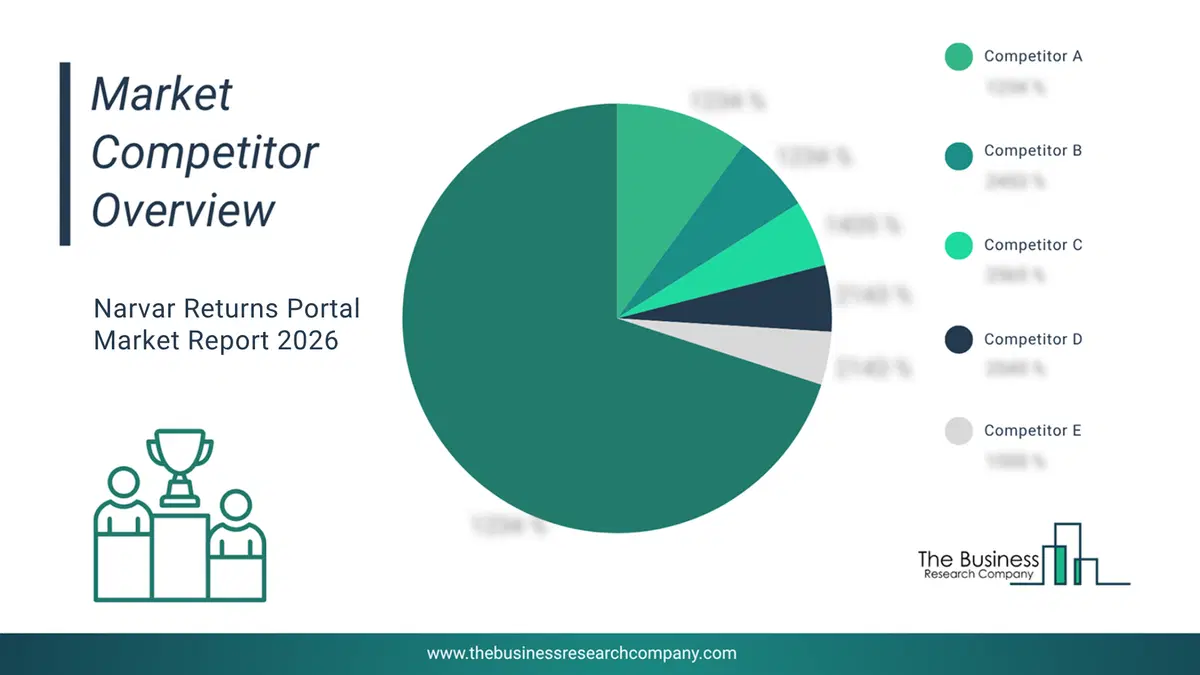
This chart is for illustrative purposes; the full report includes a detailed competitor analysis and comprehensive overview of the top 10 companies in the market.
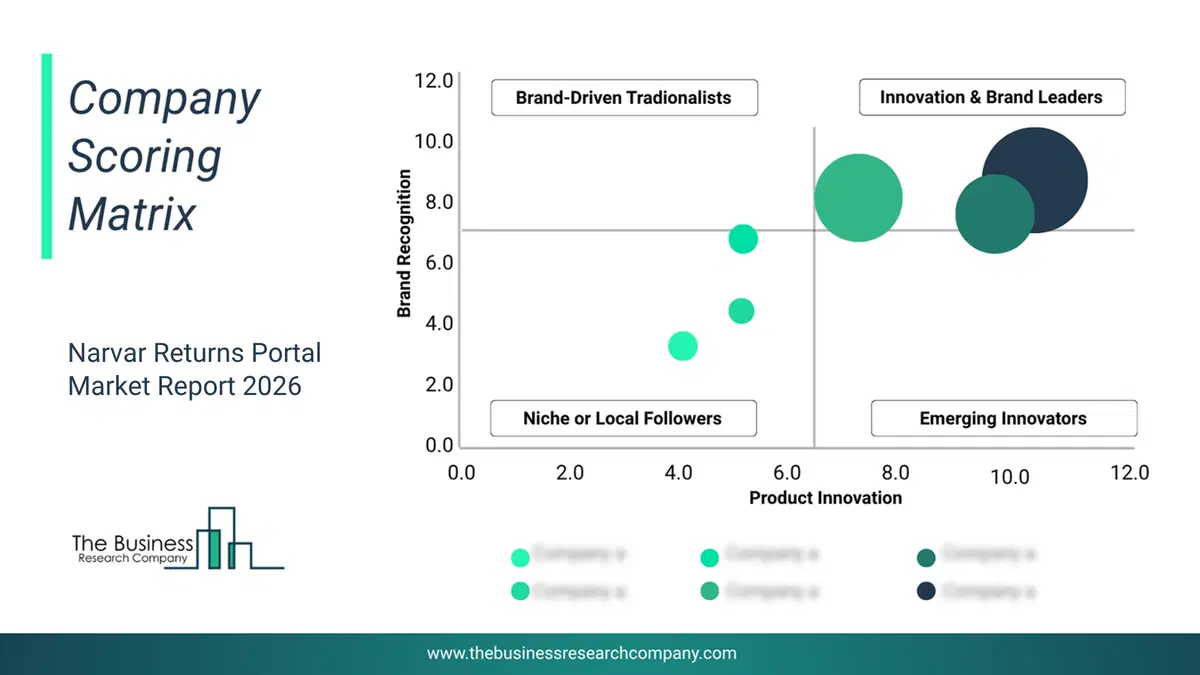
This chart maps companies by product innovation and brand strength, with bubble size indicating relative revenue, helping identify market leaders, challengers, and niche players. This is an illustrative chart; the full report provides a complete and accurate competitive analysis.
Global Narvar Returns Portal Market Trends and Insights
Major companies operating in the narvar returns portal market are focusing on developing innovative platforms, such as AI-powered returns management and fraud prevention solutions, to enhance operational efficiency, reduce return-related losses, and improve customer experience across the post-purchase journey. AI-powered returns management and fraud prevention platforms are software systems that use artificial intelligence to automate product return processes while detecting and preventing fraudulent or abusive return behavior in real time. For instance, in March 2025, Narvar Inc., a US-based post-purchase experience technology company, launched Shield, an innovative AI-powered returns management and fraud prevention solution. Shield leverages advanced machine learning models to analyze return behavior patterns, detect anomalies in return frequency and product condition claims, and dynamically flag high-risk transactions for review while allowing low-risk returns to be processed instantly. It integrates automated decisioning engines that help retailers enforce customized return policies across channels, supports real-time return authorization with minimal friction for legitimate customers, and enhances reverse logistics efficiency by optimizing routing of returned goods to the nearest warehouse, refurbishment center, or resale channel. This platform provides predictive insights for retailers to reduce return rates through actionable analytics, improve exchange conversion rates by suggesting alternative products, and minimize operational costs associated with reverse supply chains, thereby transforming returns from a cost center into a strategic value driver.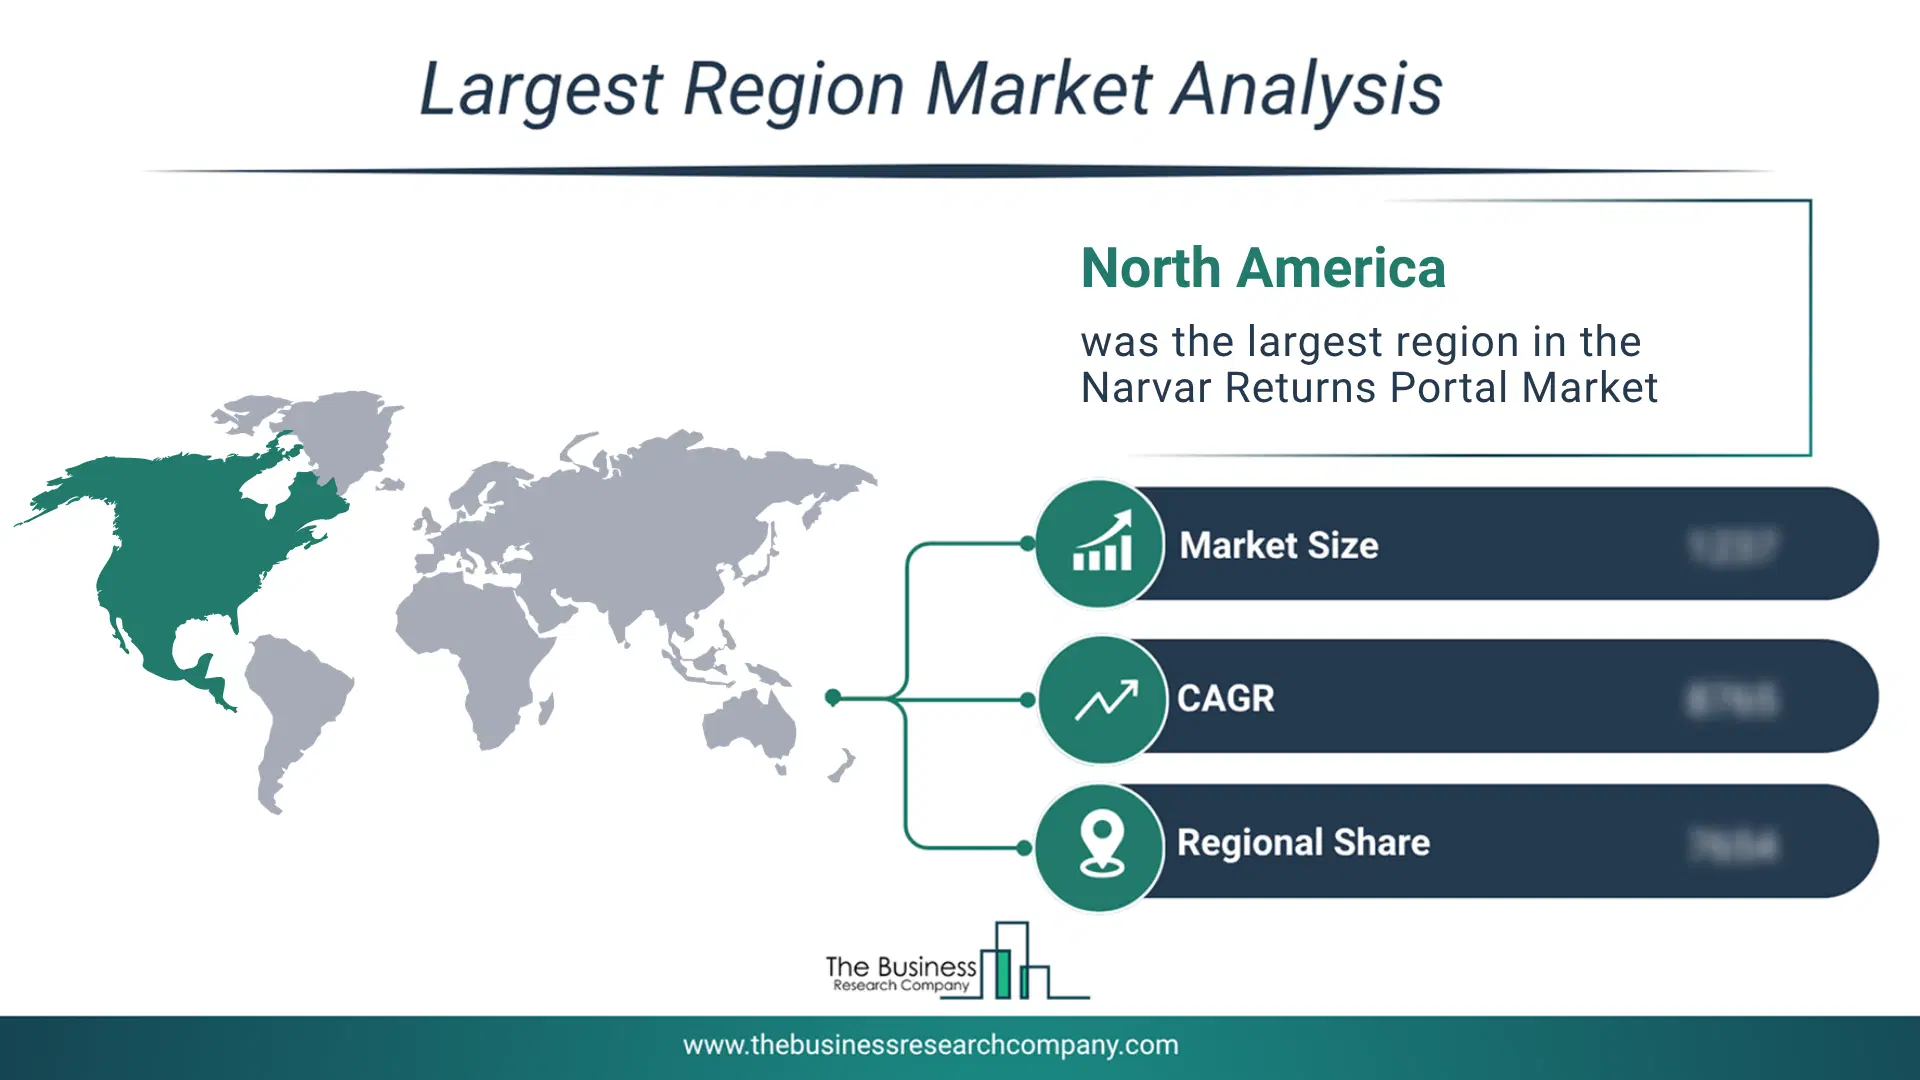
Regional Outlook
North America was the largest region in the narvar returns portal market in 2025. Asia-Pacific is expected to be the fastest-growing region in the forecast period. The regions covered in this market report are Asia-Pacific, South East Asia, Western Europe, Eastern Europe, North America, South America, Middle East, Africa. The countries covered in this market report are Australia, Brazil, China, France, Germany, India, Indonesia, Japan, Taiwan, Russia, South Korea, UK, USA, Canada, Italy, Spain.What Defines the Narvar Returns Portal Market?
The narvar returns portal market includes revenues earned by entities by providing services such as automated return authorization processing, self-service return initiation and tracking, reverse logistics coordination, exchange and refund management, and post-purchase customer communication and notifications. The market value includes the value of related goods sold by the service provider or included within the service offering. Only goods and services traded between entities or sold to end consumers are included.How is Market Value Defined and Measured?
The market value is defined as the revenues that enterprises gain from the sale of goods and/or services within the specified market and geography through sales, grants, or donations in terms of the currency (in USD unless otherwise specified). The revenues for a specified geography are consumption values that are revenues generated by organizations in the specified geography within the market, irrespective of where they are produced. It does not include revenues from resales along the supply chain, either further along the supply chain or as part of other products.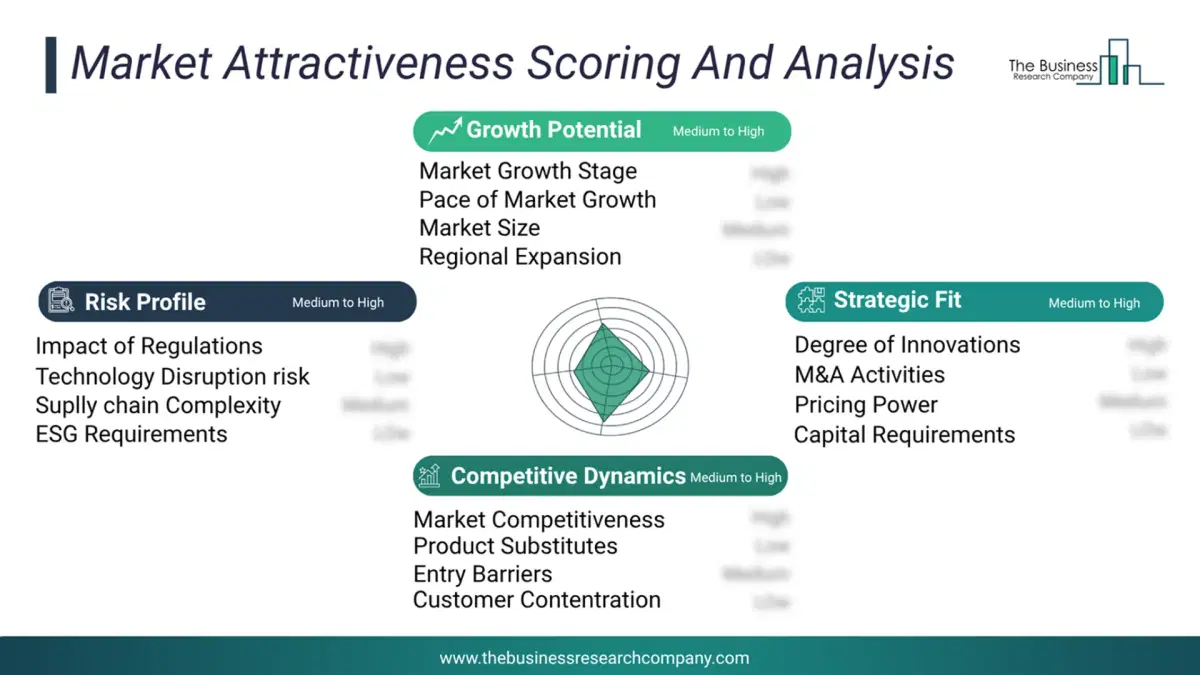
This chart presents market attractiveness based on a quantitative evaluation of growth, competition, strategic alignment, and risk, offering a clear view of opportunity areas for decision-making. This chart is for illustrative purposes; the full report contains the complete analysis.
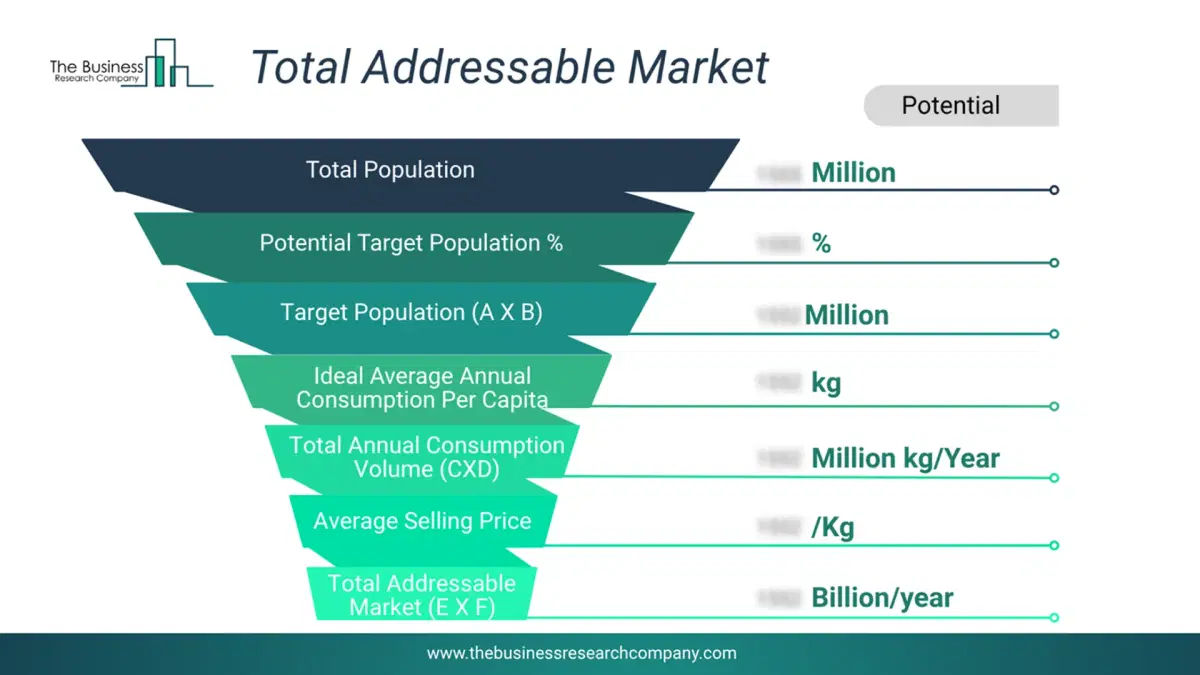
This chart highlights the Total Addressable Market (TAM) by estimating the maximum revenue opportunity using an assumption-driven approach, supporting strategic planning and opportunity sizing across markets. The chart is illustrative; the full report provides a more comprehensive analysis.
What Key Data and Analysis Are Included in the Narvar Returns Portal Market Report 2026?
The narvar returns portal market research report is one of a series of new reports from The Business Research Company that provides market statistics, including industry global market size, regional shares, competitors with the market share, detailed market segments, market trends and opportunities, and any further data you may need to thrive in the narvar returns portal industry. The market research report delivers a complete perspective of everything you need, with an in-depth analysis of the current and future state of the industry.Narvar Returns Portal Market Report Forecast Analysis
| Report Attribute | Details |
|---|---|
| Market Size Value In 2026 | $1.6 billion |
| Revenue Forecast In 2030 | $2.84 billion |
| Growth Rate | CAGR of 15.4% from 2026 to 2030 |
| Base Year For Estimation | 2025 |
| Actual Estimates/Historical Data | 2020-2025 |
| Forecast Period | 2026 - 2030 |
| Market Representation | Revenue in USD Billion and CAGR from 2026 to 2030 |
| Segments Covered | Component, Deployment Mode, Enterprise Size, Sales Channel, End User |
| Regional Scope | Asia-Pacific, Western Europe, Eastern Europe, North America, South America, Middle East, Africa |
| Country Scope | The countries covered in the report are Australia, Brazil, China, France, Germany, India, Indonesia, Japan, Taiwan, Russia, South Korea, UK, USA, Canada, Italy, Spain. |
| Key Companies Profiled | United Parcel Service Inc., Oracle Corporation, Shopify Inc., Blue Yonder Inc., Global-e Online Ltd., ShipBob Inc., nShift AB, AfterShip Ltd., Sendcloud B.V., Shippo Inc., Narvar Inc., Auctane Inc., Easyship Global Ltd., Xariable Inc., parcelLab Inc., Redo Tech Inc., ReturnGO Ltd., ReturnLogic Inc., ShippyPro S.r.l., Refundid Pty Ltd, Claimlane ApS, ClickPost Logistics Private Limited |
| Customization Scope | Request for Customization |
| Pricing And Purchase Options | Explore Purchase Options |