
Operations Optimization Solution Market Report 2026
Global Outlook – By Type (Software Solutions, Hardware Solutions), By Deployment (Cloud-Based, On-Premise), By Application (Aerospace And Defense, Automotive And Transportation, Machine Manufacturing, Energy And Utilities, Other Applications), By End-User (Large Enterprises, Small And Medium Enterprises) – Market Size, Trends, Strategies, and Forecast to 2030
Operations Optimization Solution Market Overview
• Operations Optimization Solution market size has reached to $2.26 billion in 2025 • Expected to grow to $3.96 billion in 2030 at a compound annual growth rate (CAGR) of 11.8% • Growth Driver: Rising Automation Trends Set To Accelerate Growth In The Operation Optimization Market • Market Trend: Enhancing Efficiency And Performance In Operational Solutions • North America was the largest region in 2025.What Is Covered Under Operations Optimization Solution Market?
Operation optimization solutions refer to a system or platform designed to enhance the efficiency and effectiveness of business operations. It leverages advanced technologies such as data analytics and automation to streamline processes, improve resource allocation, reduce costs, and boost productivity. These solutions are tailored to address various operational challenges across industries, aiming to optimize workflows, minimize bottlenecks, and maximize overall performance. The main types of operations optimization solutions are software solutions and hardware solutions. A software solution refers to a range of software programs and packages designed to address various security needs, such as IDSes, firewalls, antivirus programs, and network management tools, including operating system and application patches for security vulnerabilities. The deployment is cloud-based and on-premises, and the applications include aerospace and defense, automotive and transportation, machine manufacturing, energy and utilities, and others. It is used by various end-users, such as large enterprises and small and medium enterprises.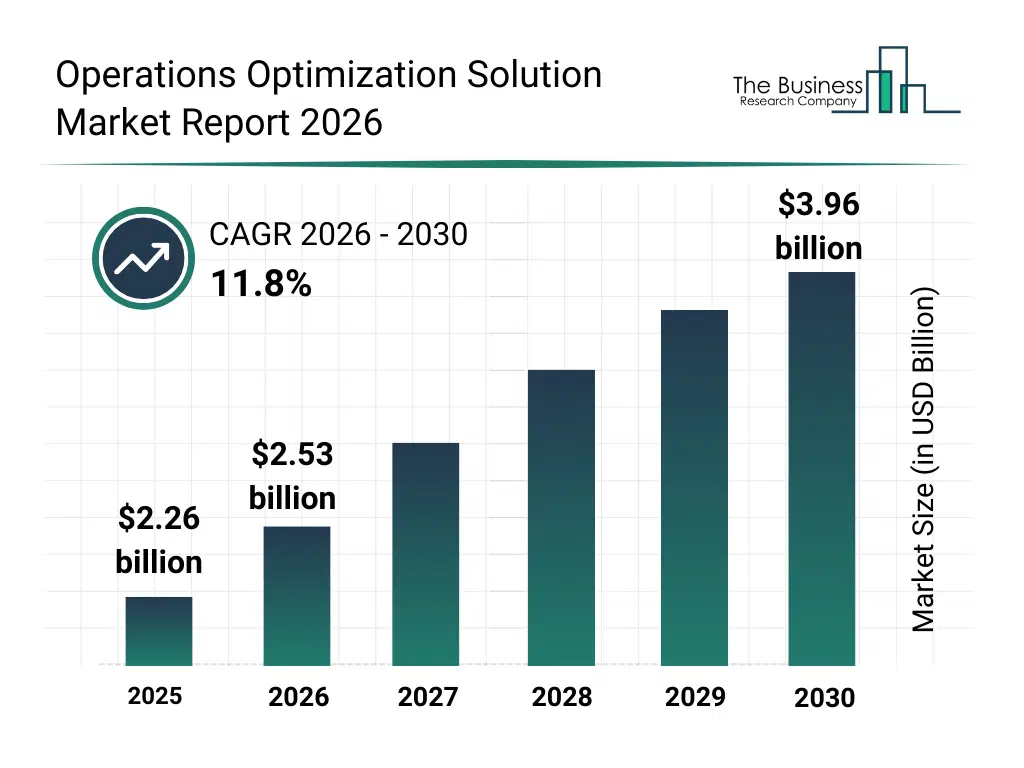
What Is The Operations Optimization Solution Market Size and Share 2026?
The operations optimization solution market size has grown rapidly in recent years. It will grow from $2.26 billion in 2025 to $2.53 billion in 2026 at a compound annual growth rate (CAGR) of 12.1%. The growth in the historic period can be attributed to need for cost reduction, growth of enterprise digitization, increasing operational complexity, demand for productivity improvement, adoption of analytics tools.What Is The Operations Optimization Solution Market Growth Forecast?
The operations optimization solution market size is expected to see rapid growth in the next few years. It will grow to $3.96 billion in 2030 at a compound annual growth rate (CAGR) of 11.8%. The growth in the forecast period can be attributed to integration of AI in operations, expansion of industrial iot, focus on sustainable operations, real-time decision making demand, cloud-based optimization platforms. Major trends in the forecast period include data-driven process optimization, predictive analytics for operations, workflow automation, resource utilization optimization, real-time operational visibility.
Global Operations Optimization Solution Market Segmentation
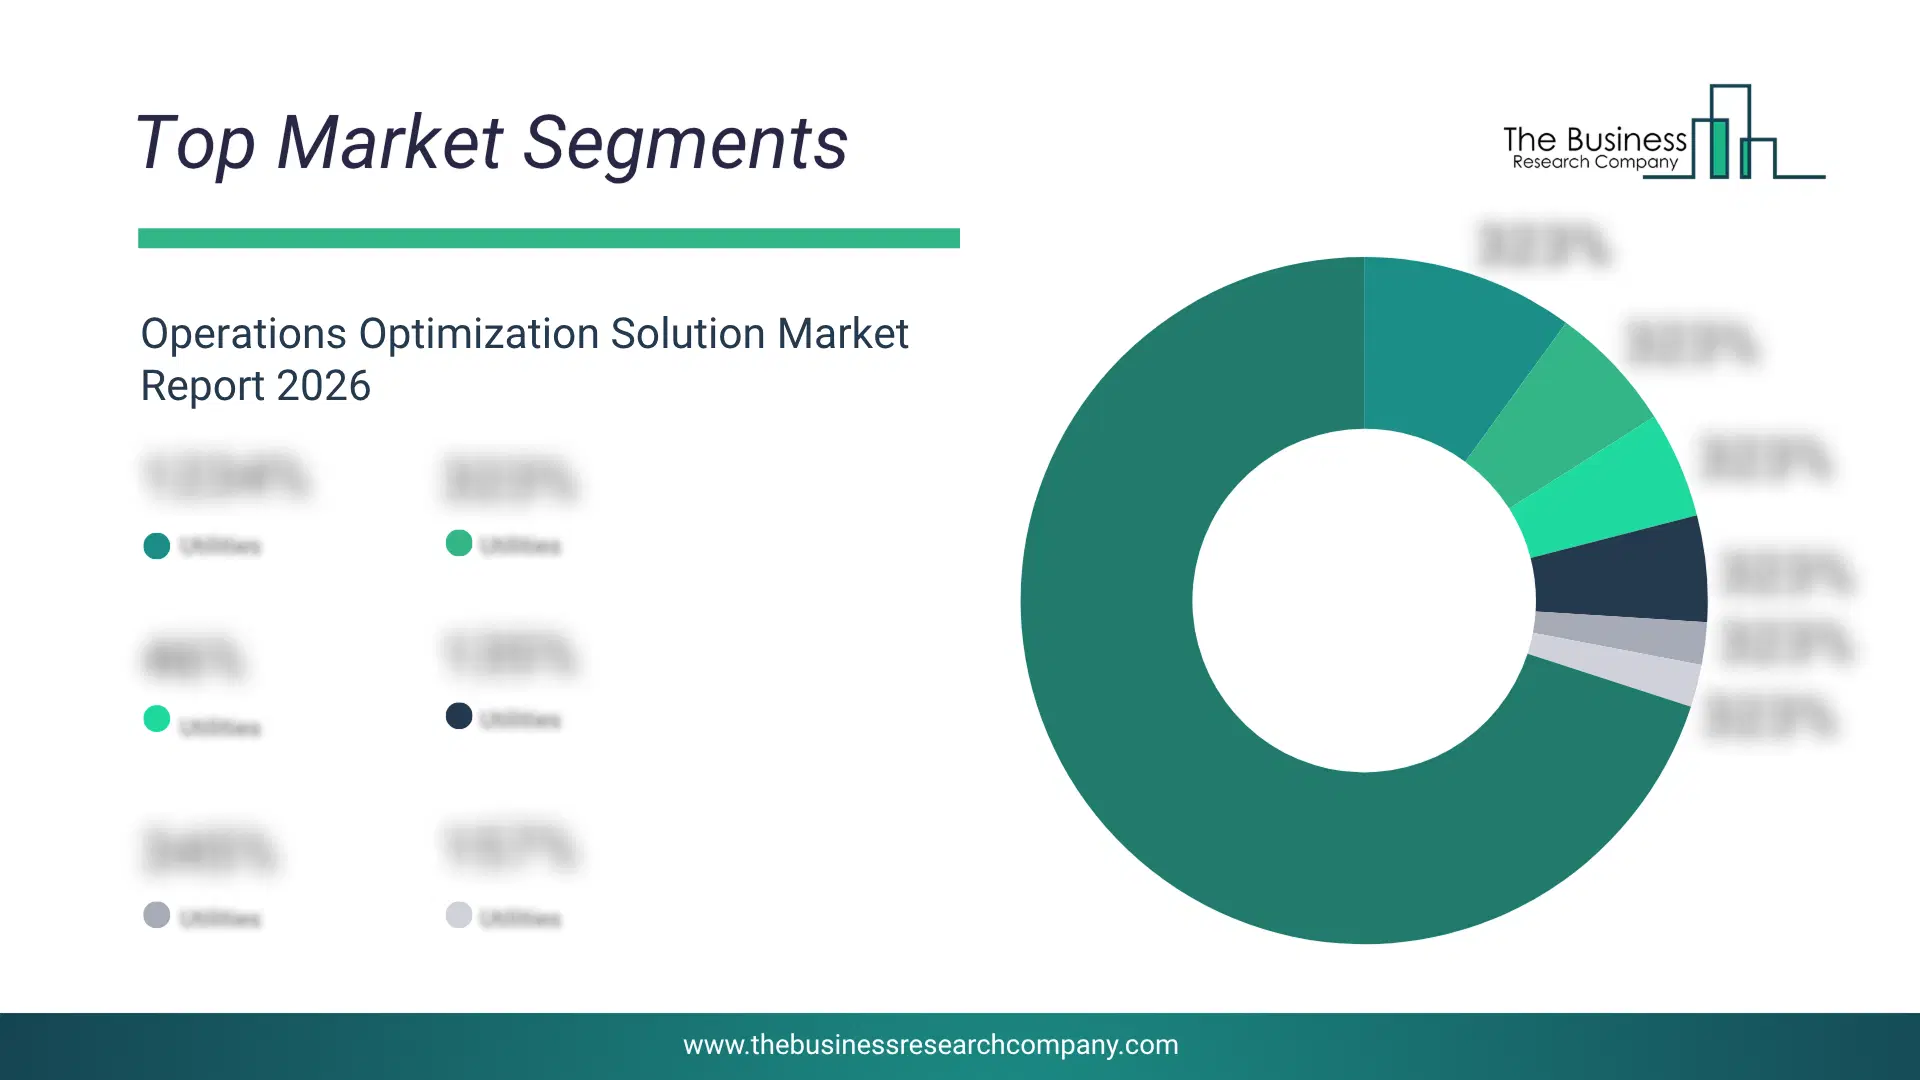
1) By Type: Software Solutions, Hardware Solutions 2) By Deployment: Cloud-Based, On-Premise 3) By Application: Aerospace And Defense, Automotive And Transportation, Machine Manufacturing, Energy And Utilities, Other Applications 4) By End-User: Large Enterprises, Small And Medium Enterprises Subsegments: 1) By Software Solutions: Enterprise Resource Planning (ERP) Software, Supply Chain Management (SCM) Software, Customer Relationship Management (CRM) Software, Predictive Analytics Software, Workforce Management Software, Maintenance Management Software, Inventory Management Software, Business Intelligence (BI) Software, Process Automation Software, Demand Forecasting Software 2) By Hardware Solutions: Industrial IoT Devices, Sensors and Actuators, RFID And Barcode Systems, Smart Meters And Energy Monitoring Devices, Automated Guided Vehicles (AGVs), Robotics And Automation Systems, Machine Vision Systems, Control Systems And SCADA, Asset Tracking HardwareWhat Is The Driver Of The Operations Optimization Solution Market?
The increasing trend of automation is expected to propel the growth in the operation optimization solution market going forward. The increase in automation trends is driven by the demand for enhanced efficiency, cost reduction, and precision across industries. Operation optimization solutions for automation enhance efficiency by streamlining processes, reducing downtime, and improving resource utilization in various industries. For instance, in September 2023, according to the International Federation of Robotics, a Germany-based non-profit organization, there were 553,052 industrial robot installations in factories globally, reflecting a year-on-year growth rate of 5% in 2022. Therefore, the increasing trend of automation is driving the growth of the operation optimization solution market.Key Players In The Global Operations Optimization Solution Market
Major companies operating in the operations optimization solution market are Microsoft Corporation, Siemens AG, International Business Machines Corporation, Oracle Systems Corporation, Schneider Electric SE, Mitsubishi Electric Corporation, Honeywell International Inc., SAP SE, ABB Ltd., Parker-Hannifin Corporation, Rockwell Automation Inc., KUKA Robotics, Infor Inc., AVEVA Group plc, Aspen Technology, Celonis SE, Anaplan Inc., ServiceTitan, TIBCO Software Inc., Qlik Technologies Inc., DataRobot Inc., Domo Inc., Sisense Ltd, BigFix Inc.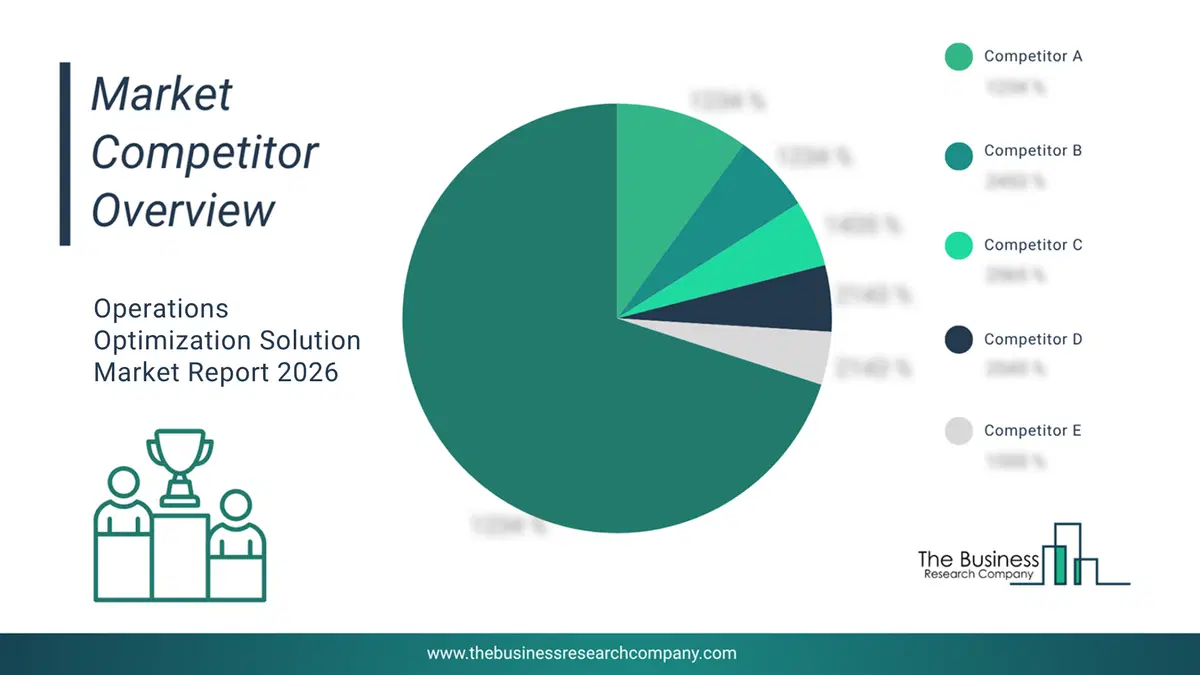
This chart is for illustrative purposes; the full report includes a detailed competitor analysis and comprehensive overview of the top 10 companies in the market.
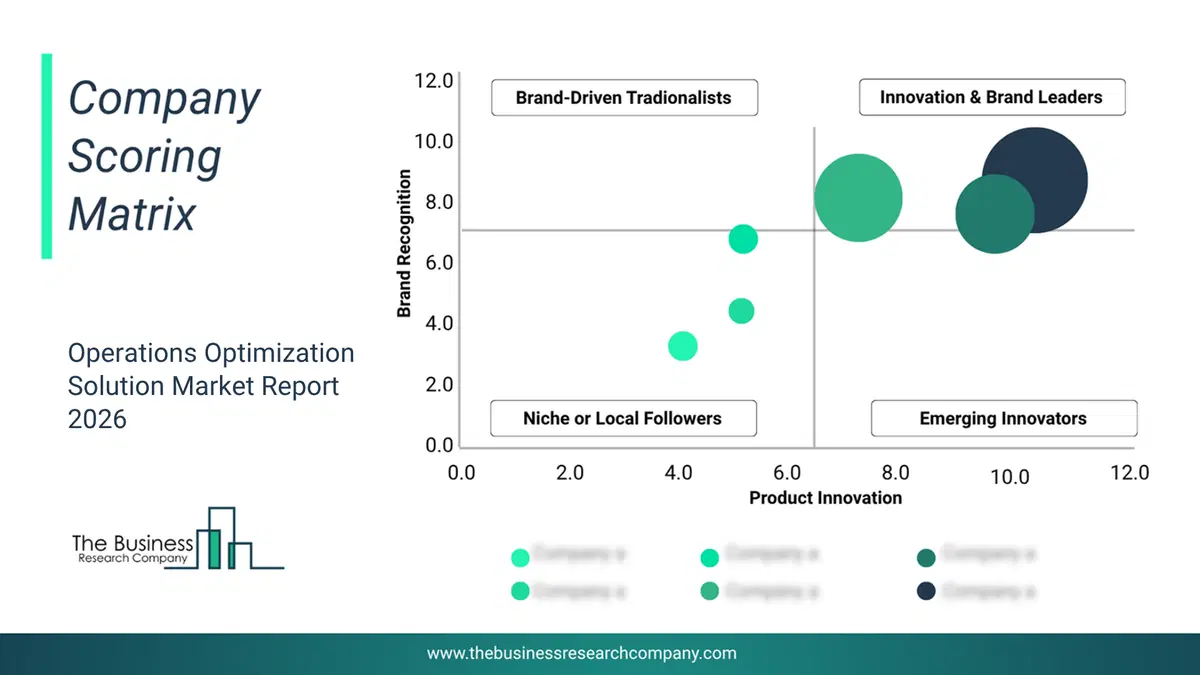
This chart maps companies by product innovation and brand strength, with bubble size indicating relative revenue, helping identify market leaders, challengers, and niche players. This is an illustrative chart; the full report provides a complete and accurate competitive analysis.
Global Operations Optimization Solution Market Trends and Insights
Major companies operating in the operation optimization solution market are focused on developing advanced technology such as optimization-as-a-service (OaaS) to enhance efficiency and performance. Optimization-as-a-Service (OaaS) refers to a cloud-based service model that offers optimization algorithms and tools to improve performance, efficiency, or decision-making in various applications without requiring users to manage the underlying infrastructure. For instance, in November 2023, Realtime Robotics, a US-based technology, autonomously launched optimization-as-a-service (OaaS) to help manufacturers quickly reduce cycle time. This innovative solution aims to enhance manufacturing efficiency by reducing cycle times and improving overall productivity without disrupting existing operations. Key features include rapid path optimization, digital twin analysis, and automatic interlocks to increase overall productivity without significant downtime.What Are Latest Mergers And Acquisitions In The Operations Optimization Solution Market?
In January 2024, Relex Solution, a Finland-based provider of unified supply chains, acquired Optimity for an undisclosed amount. This acquisition aims to enhance its retail and supply chain platform by integrating advanced capabilities in daily production planning, optimization, and scheduling. Optimity is a Finland-based provider of supply chain planning and optimization solutions.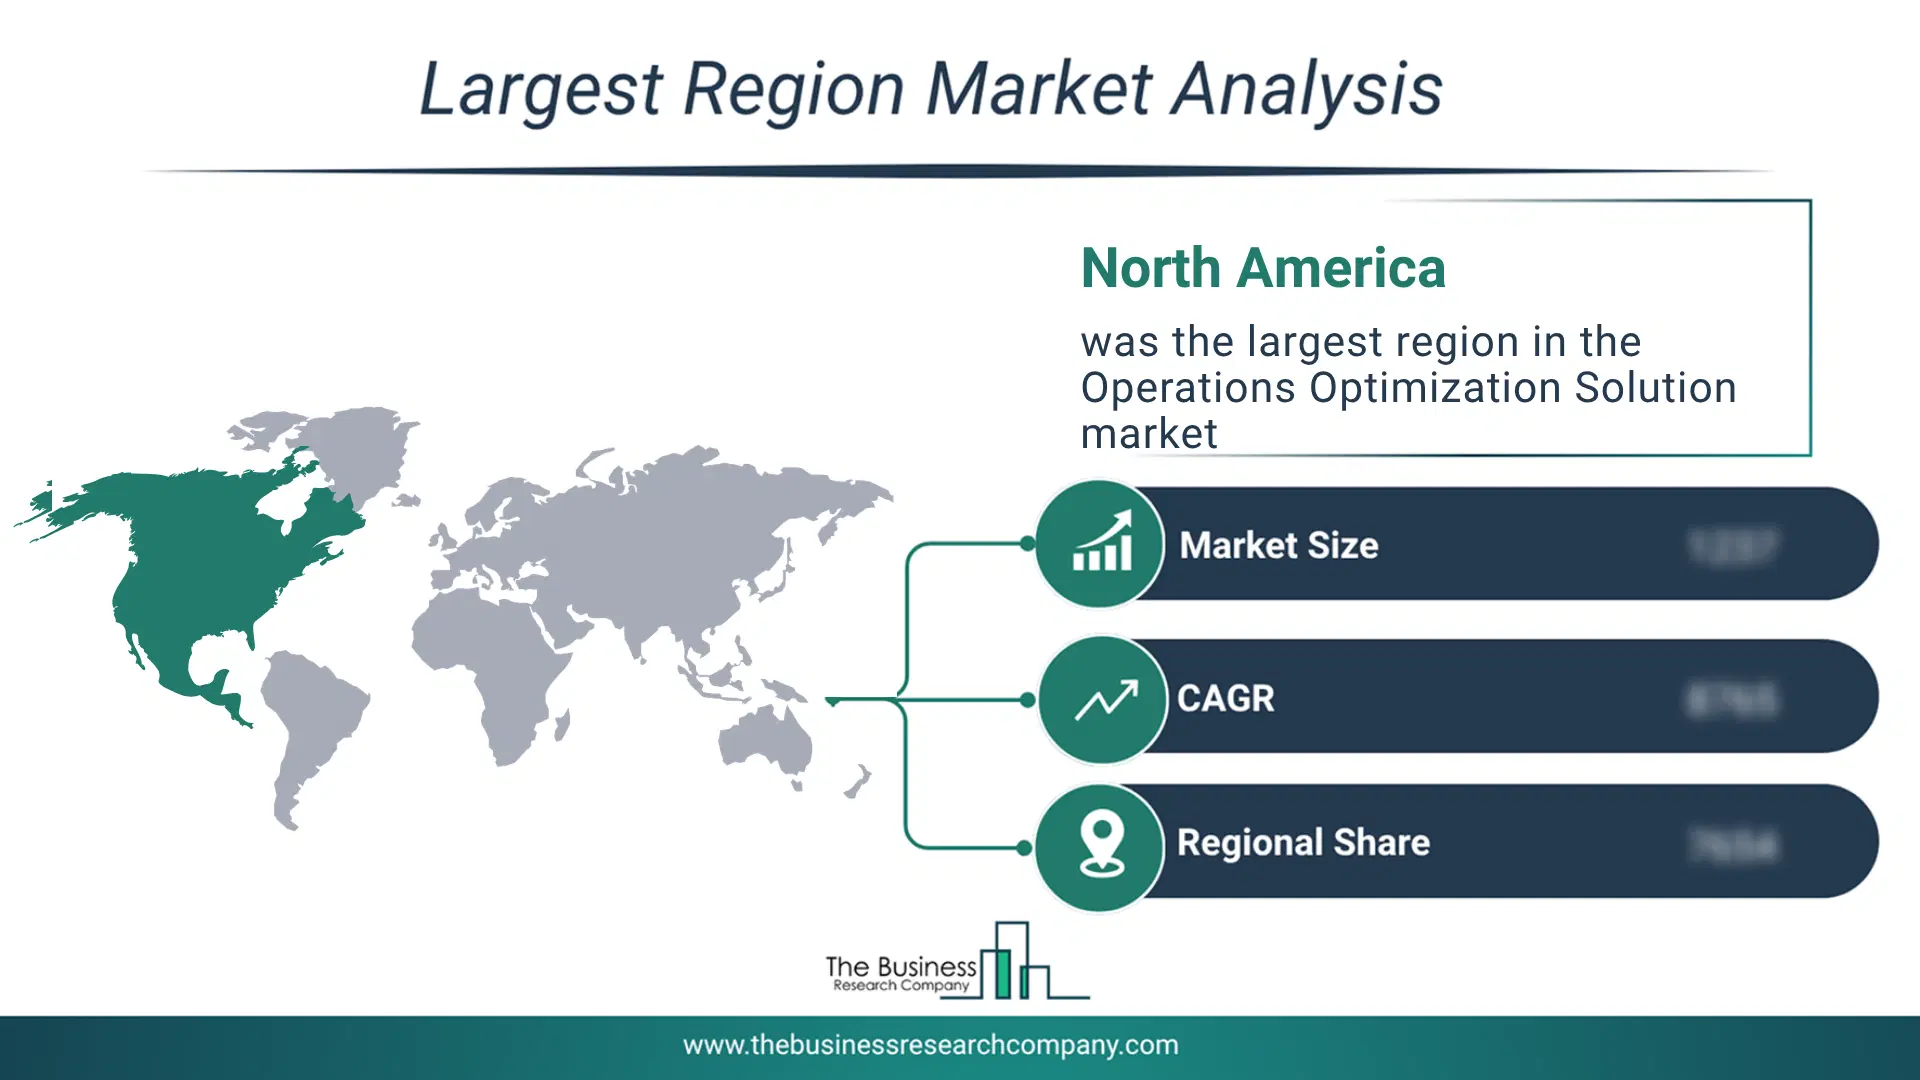
Regional Insights
North America was the largest region in the operation optimization solutions market in 2025. The regions covered in this market report are Asia-Pacific, South East Asia, Western Europe, Eastern Europe, North America, South America, Middle East, Africa. The countries covered in this market report are Australia, Brazil, China, France, Germany, India, Indonesia, Japan, Taiwan, Russia, South Korea, UK, USA, Canada, Italy, Spain.What Defines the Operations Optimization Solution Market?
The operation optimization solutions market consists of revenues earned by entities by providing services such as process automation, supply chain optimization, data analytics, and business intelligence. The market value includes the value of related goods sold by the service provider or included within the service offering. The operation optimization solutions market also includes sales of internet of things (IoT), devices and sensors, edge computing devices, control systems, and PLCs (programmable logic controllers). Values in this market are ‘factory gate’ values, that is the value of goods sold by the manufacturers or creators of the goods, whether to other entities (including downstream manufacturers, wholesalers, distributors and retailers) or directly to end customers. The value of goods in this market includes related services sold by the creators of the goods.How is Market Value Defined and Measured?
The market value is defined as the revenues that enterprises gain from the sale of goods and/or services within the specified market and geography through sales, grants, or donations in terms of the currency (in USD unless otherwise specified). The revenues for a specified geography are consumption values that are revenues generated by organizations in the specified geography within the market, irrespective of where they are produced. It does not include revenues from resales along the supply chain, either further along the supply chain or as part of other products.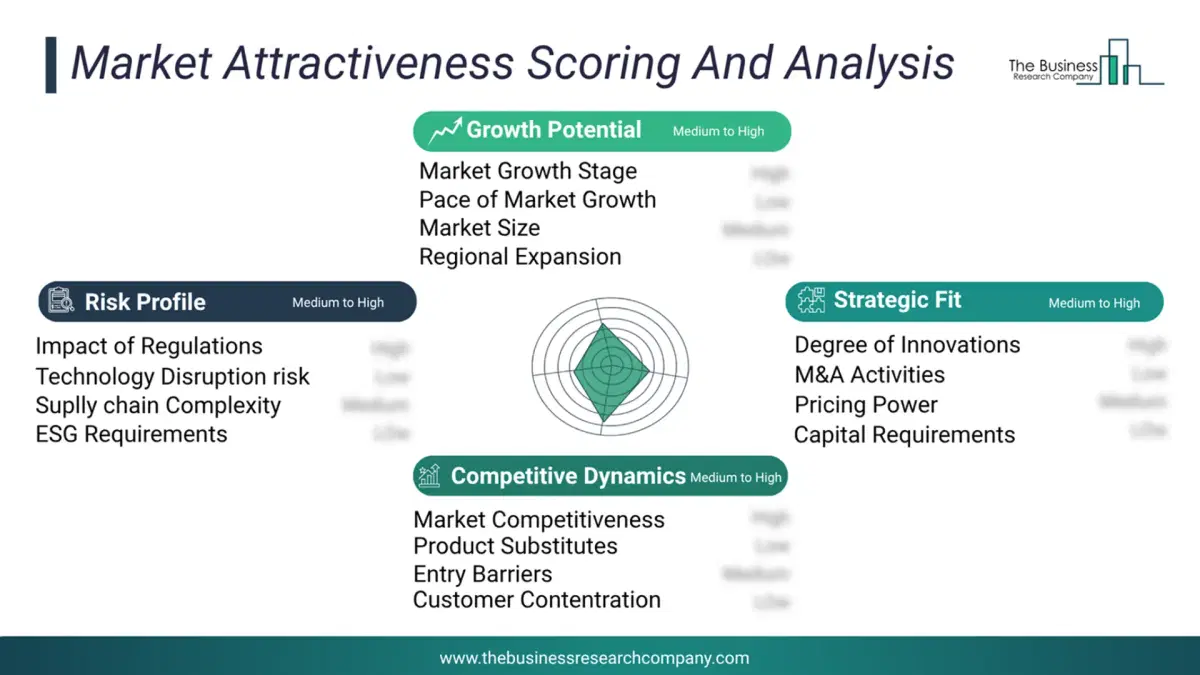
This chart presents market attractiveness based on a quantitative evaluation of growth, competition, strategic alignment, and risk, offering a clear view of opportunity areas for decision-making. This chart is for illustrative purposes; the full report contains the complete analysis.
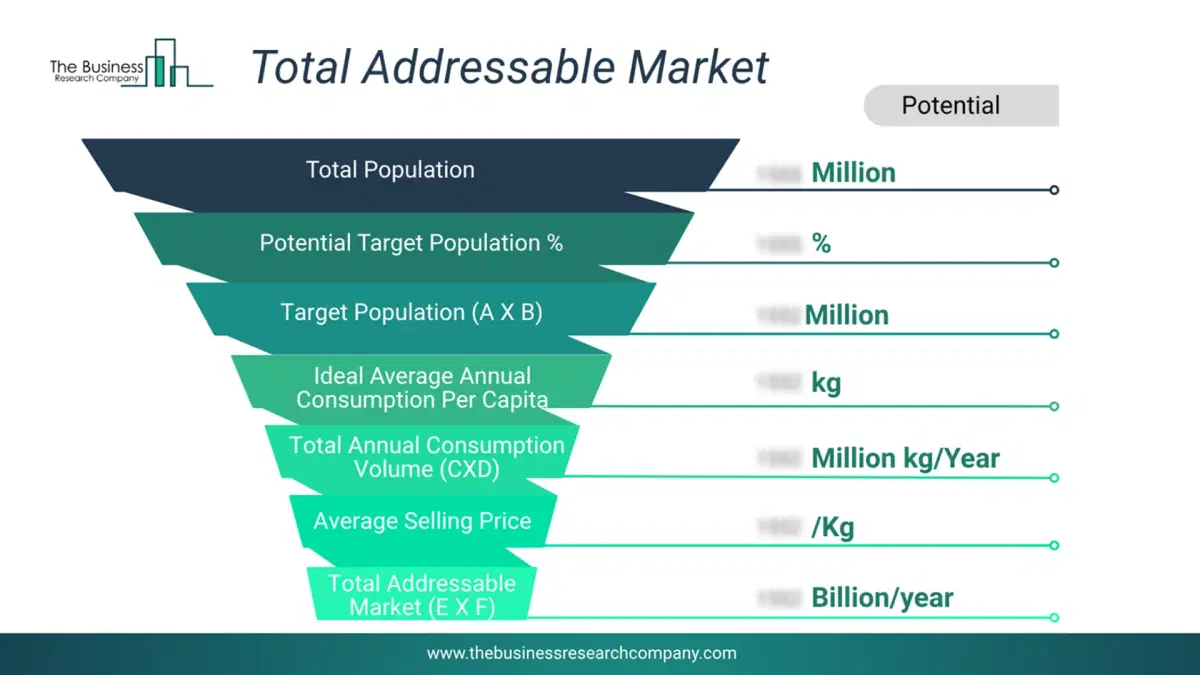
This chart highlights the Total Addressable Market (TAM) by estimating the maximum revenue opportunity using an assumption-driven approach, supporting strategic planning and opportunity sizing across markets. The chart is illustrative; the full report provides a more comprehensive analysis.
What Key Data and Analysis Are Included in the Operations Optimization Solution Market Report 2026?
The operations optimization solution market research report is one of a series of new reports from The Business Research Company that provides market statistics, including industry global market size, regional shares, competitors with the market share, detailed market segments, market trends and opportunities, and any further data you may need to thrive in the operations optimization solution industry. The market research report delivers a complete perspective of everything you need, with an in-depth analysis of the current and future state of the industry.Operations Optimization Solution Market Report Forecast Analysis
| Report Attribute | Details |
|---|---|
| Market Size Value In 2026 | $2.53 billion |
| Revenue Forecast In 2030 | $3.96 billion |
| Growth Rate | CAGR of 11.8% from 2026 to 2030 |
| Base Year For Estimation | 2025 |
| Actual Estimates/Historical Data | 2020-2025 |
| Forecast Period | 2026 - 2030 |
| Market Representation | Revenue in USD Billion and CAGR from 2026 to 2030 |
| Segments Covered | Type, Deployment, Application, End-User |
| Regional Scope | Asia-Pacific, Western Europe, Eastern Europe, North America, South America, Middle East, Africa |
| Country Scope | The Countries Covered In This Market Report Are Australia, Brazil, China, France, Germany, India, Indonesia, Japan, Taiwan, Russia, South Korea, Uk, Usa, Canada, Italy, Spain. |
| Key Companies Profiled | Microsoft Corporation, Siemens AG, International Business Machines Corporation, Oracle Systems Corporation, Schneider Electric SE, Mitsubishi Electric Corporation, Honeywell International Inc., SAP SE, ABB Ltd., Parker-Hannifin Corporation, Rockwell Automation Inc., KUKA Robotics, Infor Inc., AVEVA Group plc, Aspen Technology, Celonis SE, Anaplan Inc., ServiceTitan, TIBCO Software Inc., Qlik Technologies Inc., DataRobot Inc., Domo Inc., Sisense Ltd, BigFix Inc. |
| Customization Scope | Request for Customization |
| Pricing And Purchase Options | Explore Purchase Options |