
Project Timeline Wall Chart Market Report 2026
Global Outlook – By Product Type (Dry Erase Wall Charts, Magnetic Wall Charts, Adhesive Wall Charts, Digital Wall Charts, Other Product Types), By Material (Paper, Plastic, Metal, Vinyl, Other Materials), By Distribution Channel (Online Stores, Specialty Stores, Supermarkets Or Hypermarkets, Other Distribution Channels), By Application (Education, Corporate Offices, Project Management, Home Use, Other Applications) – Market Size, Trends, Strategies, and Forecast to 2030
Project Timeline Wall Chart Market Report 2026 Market Overview
• Project Timeline Wall Chart Market Report 2026 market size has reached to $1.26 billion in 2025 • Expected to grow to $1.93 billion in 2030 at a compound annual growth rate (CAGR) of 8.7% • Growth Driver: Expansion Of Construction And Infrastructure Projects Driving The Market Growth Due To Increasing Demand For Organized Project Planning Tools • North America was the largest region in 2025 and Asia-Pacific is the fastest growing region.What Is Covered Under Project Timeline Wall Chart Market?
A project timeline wall chart is a visual planning tool designed to display the sequence, duration, and progress of tasks or activities in a project over a defined period. It presents time-based information in a structured horizontal or vertical layout, allowing easy tracking of milestones and scheduled work. A project timeline wall chart helps in visualizing overall project flow and monitoring progress in a clear, organized manner. The main product types of project timeline wall chart include dry erase wall charts, magnetic wall charts, adhesive wall charts, digital wall charts, and other product types. Dry erase wall charts refer to reusable planning charts designed for tracking project timelines and schedules using erasable markers for easy updates. These products are made using materials such as paper, plastic, metal, vinyl, and other materials. They are distributed through online stores, specialty stores, supermarkets or hypermarkets, and others and various applications involved are education, corporate offices, project management, home use, and others.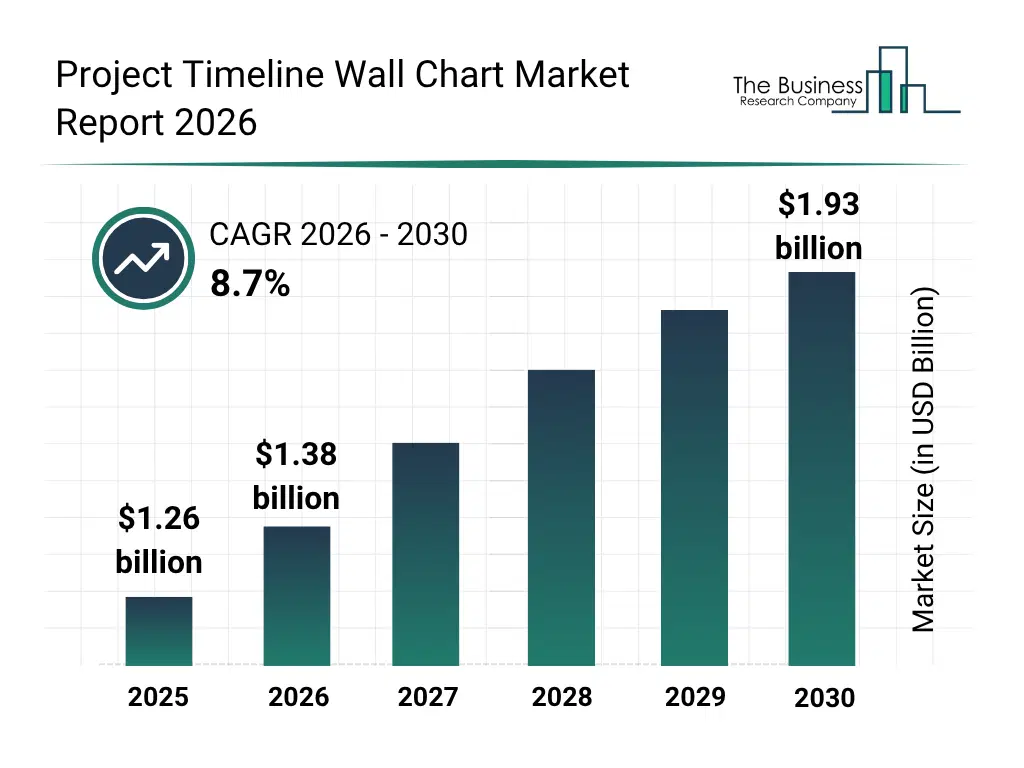
What Is The Project Timeline Wall Chart Market Size and Share 2026?
The project timeline wall chart market size has grown strongly in recent years. It will grow from $1.26 billion in 2025 to $1.38 billion in 2026 at a compound annual growth rate (CAGR) of 9.1%. The growth in the historic period can be attributed to increasing adoption of traditional gantt and timeline planning tools, rising demand for structured project management practices, expansion of corporate office project coordination needs, growing use of visual planning tools in education and training, increasing complexity of multi phase projects.What Is The Project Timeline Wall Chart Market Growth Forecast?
The project timeline wall chart market size is expected to see strong growth in the next few years. It will grow to $1.93 billion in 2030 at a compound annual growth rate (CAGR) of 8.7%. The growth in the forecast period can be attributed to rising adoption of digital project management platforms, increasing integration of AI in workflow planning tools, growth in remote and hybrid team collaboration, expansion of smart office and connected workspace systems, increasing demand for real time project visibility and analytics. Major trends in the forecast period include AI powered predictive project scheduling and timeline optimization systems, cloud based collaborative project visualization platforms, IoT enabled real time progress tracking wall displays, digital twin based project planning and simulation dashboards, hybrid physical digital project timeline management solutions.
Global Project Timeline Wall Chart Market Segmentation
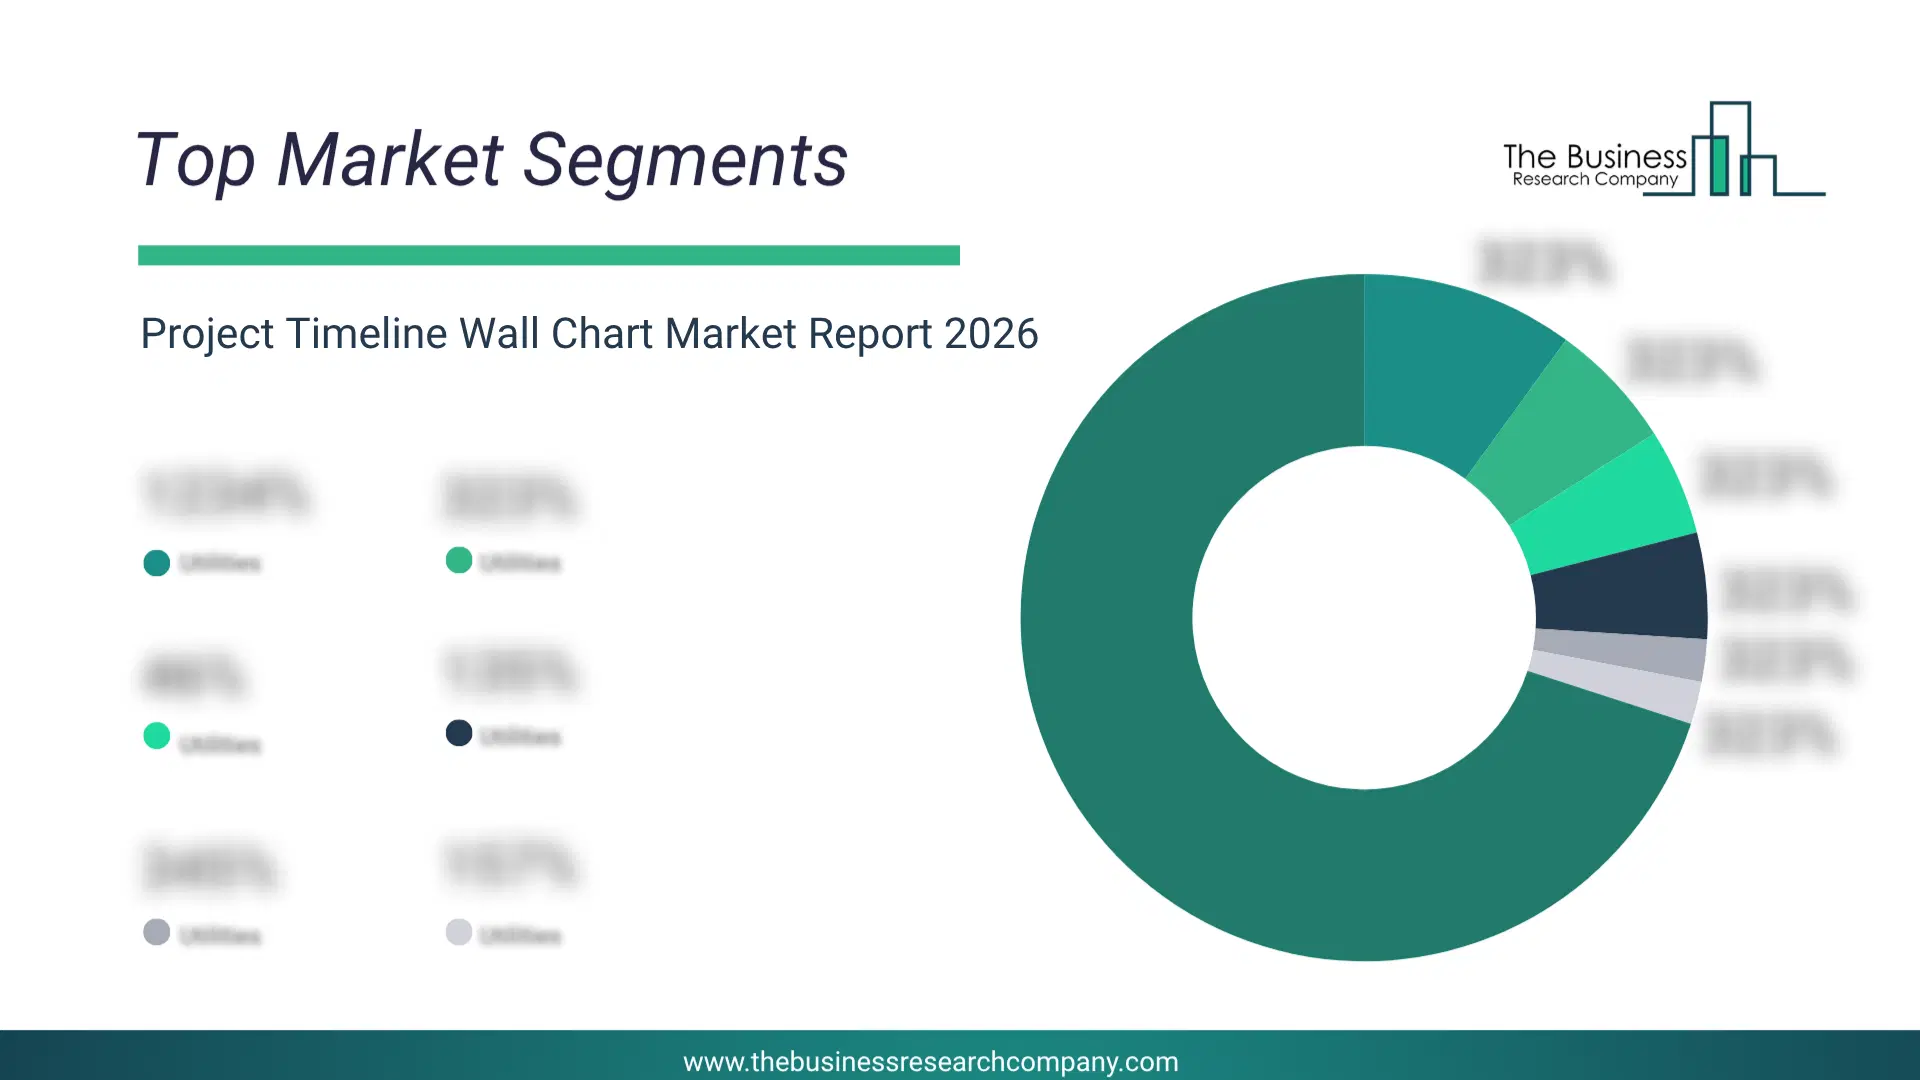
1) By Product Type: Dry Erase Wall Charts, Magnetic Wall Charts, Adhesive Wall Charts, Digital Wall Charts, Other Product Types 2) By Material: Paper, Plastic, Metal, Vinyl, Other Materials 3) By Distribution Channel: Online Stores, Specialty Stores, Supermarkets Or Hypermarkets, Other Distribution Channels 4) By Application: Education, Corporate Offices, Project Management, Home Use, Other Applications Subsegments: 1) By Dry Erase Wall Charts: Portable Dry Erase Wall Charts, Grid Layout Dry Erase Wall Charts, Laminated Dry Erase Wall Charts, Custom Printed Dry Erase Wall Charts, Reusable Planning Dry Erase Wall Charts 2) By Magnetic Wall Charts: Magnetic Scheduling Wall Charts, Steel Backed Magnetic Wall Charts, Color Coded Magnetic Wall Charts, Moveable Strip Magnetic Wall Charts, Industrial Magnetic Planning Wall Charts 3) By Adhesive Wall Charts: Peel And Stick Timeline Wall Charts, Repositionable Adhesive Planning Charts, Writable Adhesive Wall Charts, Self Adhesive Calendar Wall Charts, Removable Project Tracking Wall Charts 4) By Digital Wall Charts: Cloud Based Digital Wall Charts, Interactive Touchscreen Wall Charts, Collaborative Project Visualization Boards, Real Time Timeline Management Displays, Artificial Intelligence Enabled Planning Charts 5) By Other Product Types: Corkboard Timeline Charts, Fabric Based Planning Boards, Hybrid Physical Digital Planning Boards, Glass Surface Timeline Boards, Modular Project Visualization PanelsWhat Are The Drivers Of The Project Timeline Wall Chart Market?
The expansion of construction and infrastructure projects is expected to propel the growth of the project timeline wall chart market going forward. Construction and infrastructure involve the planning, development, and maintenance of buildings, transportation systems, utilities, and public facilities that support economic growth and societal needs. The growing scale of construction and infrastructure projects is largely driven by rising public and private investments in infrastructure, as governments and corporations allocate increasing capital toward transportation, energy, manufacturing, and institutional facilities, leading to larger and more complex project portfolios that require structured planning. The surge in construction activity increases demand for project timeline wall charts by requiring efficient scheduling, progress tracking, and coordination of multiple tasks and project milestones to ensure timely completion. For instance, in July 2025, according to the Office for National Statistics, a UK-based government department, total investment in the infrastructure sector reached £20.3 billion ($23.64 billion) in 2024, marking a 16.9% increase compared to 2023. Therefore, the expansion of construction and infrastructure projects is driving the growth of the project timeline wall chart industry. The growth of the educational and training sector is expected to propel the growth of the project timeline wall chart market going forward. The educational and training sector refers to the broad network of institutions, programs, and organizations that provide structured learning, skill development, and professional development to students and working professionals. The educational and training sector is rising primarily due to a rapid increase in student and workforce enrollment, as more individuals across all age groups are pursuing formal education and upskilling programs to meet evolving academic and professional demands. The surge in learners and training participants directly increases the need for visual planning and scheduling tools such as project timeline wall charts to organize curricula, training schedules, and program timelines efficiently. For instance, in November 2025, according to the Department for Education, a UK-based government department, that in Q4 2024, 50% of people aged 19–64 had qualifications at NQF Level 4 or higher, while 68% reached Level 3 or above and 84% attained at least Level 2. Therefore, the growth of the educational and training sector is driving the growth of the project timeline wall chart industry. The rising number of corporate events and strategic planning activities is expected to propel the growth of the project timeline wall chart market going forward. Corporate events and strategic planning activities refer to organized business gatherings and coordinated planning processes used by companies to communicate, align objectives, and execute long-term organizational goals. The rise in corporate events and strategic planning activities is driven by increasing organizational focus on collaboration, as companies use structured meetings and planning sessions to improve coordination, align teams, and support faster decision-making. The project timeline wall chart helps corporate events and strategic planning activities by providing a clear visual schedule that improves coordination, tracks deadlines, and ensures timely execution of all tasks and event milestones. For instance, in February 2026, according to the Conference News company, a UK-based media company, medium- and large-scale meetings, involving 101–500 delegates, represented 22% of all events in 2024, rising significantly from 15% in the previous year. Therefore, the rising number of corporate events and strategic planning activities is driving the growth of the project timeline wall chart industry.Key Players In The Global Project Timeline Wall Chart Market
Major companies operating in the project timeline wall chart market report are Staples Inc, Kokuyo Co Ltd, ACCO Brands Corporation, Mural Technologies Inc, Legamaster International BV, Ghent Manufacturing Inc, Genially Web SL, Pragati Systems, U Brands LLC, Logovisual Ltd, Viz-Pro Group, FRANKEN GmbH, ORGATEX GmbH & Co KG, Deli Group Co Ltd, Scribbledo LLC, Easy WebContent Inc, The Magnet Shop Limited, Taizhou Hualong Office Products Co Ltd, Cadence Management Corporation BV, Piktochart Sdn Bhd, Asana Inc, Monday.com Ltd, Atlassian Corporation, Avery Products Corporation, Magnetic North AB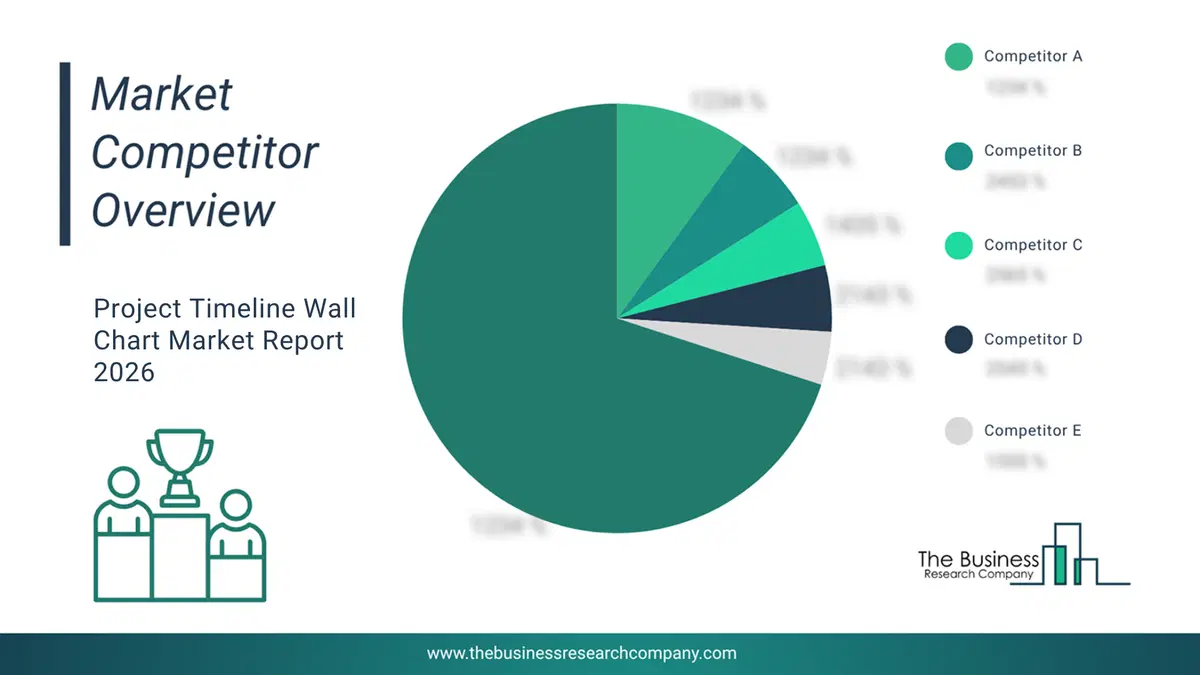
This chart is for illustrative purposes; the full report includes a detailed competitor analysis and comprehensive overview of the top 10 companies in the market.
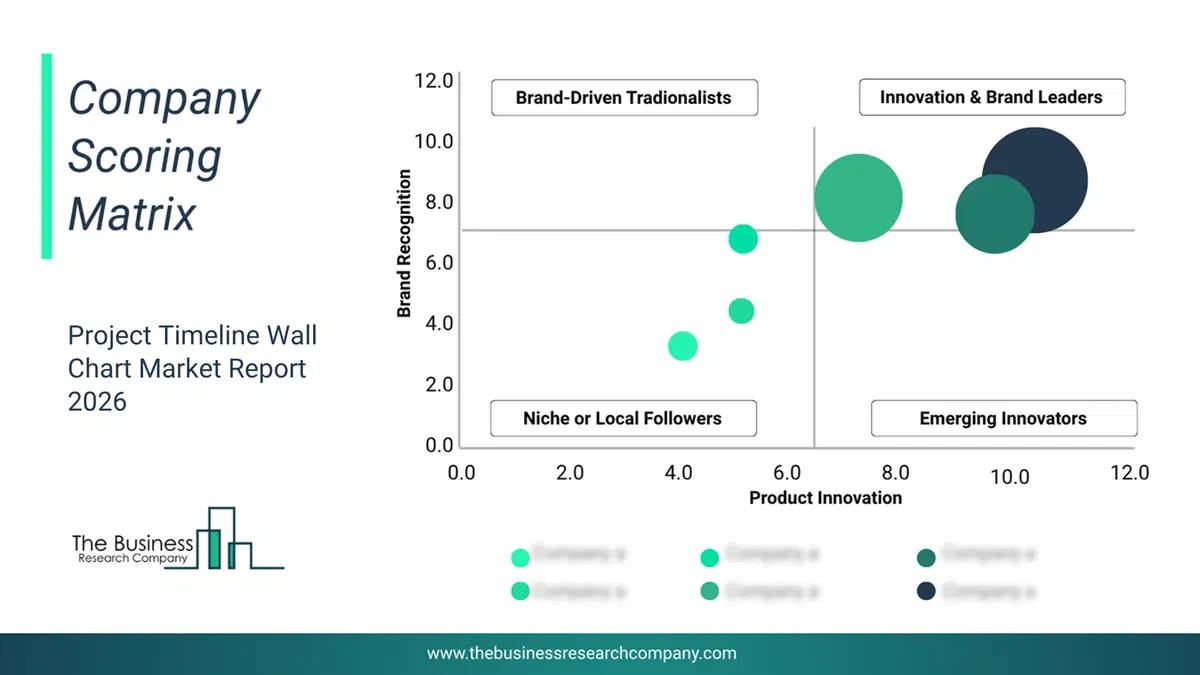
This chart maps companies by product innovation and brand strength, with bubble size indicating relative revenue, helping identify market leaders, challengers, and niche players. This is an illustrative chart; the full report provides a complete and accurate competitive analysis.
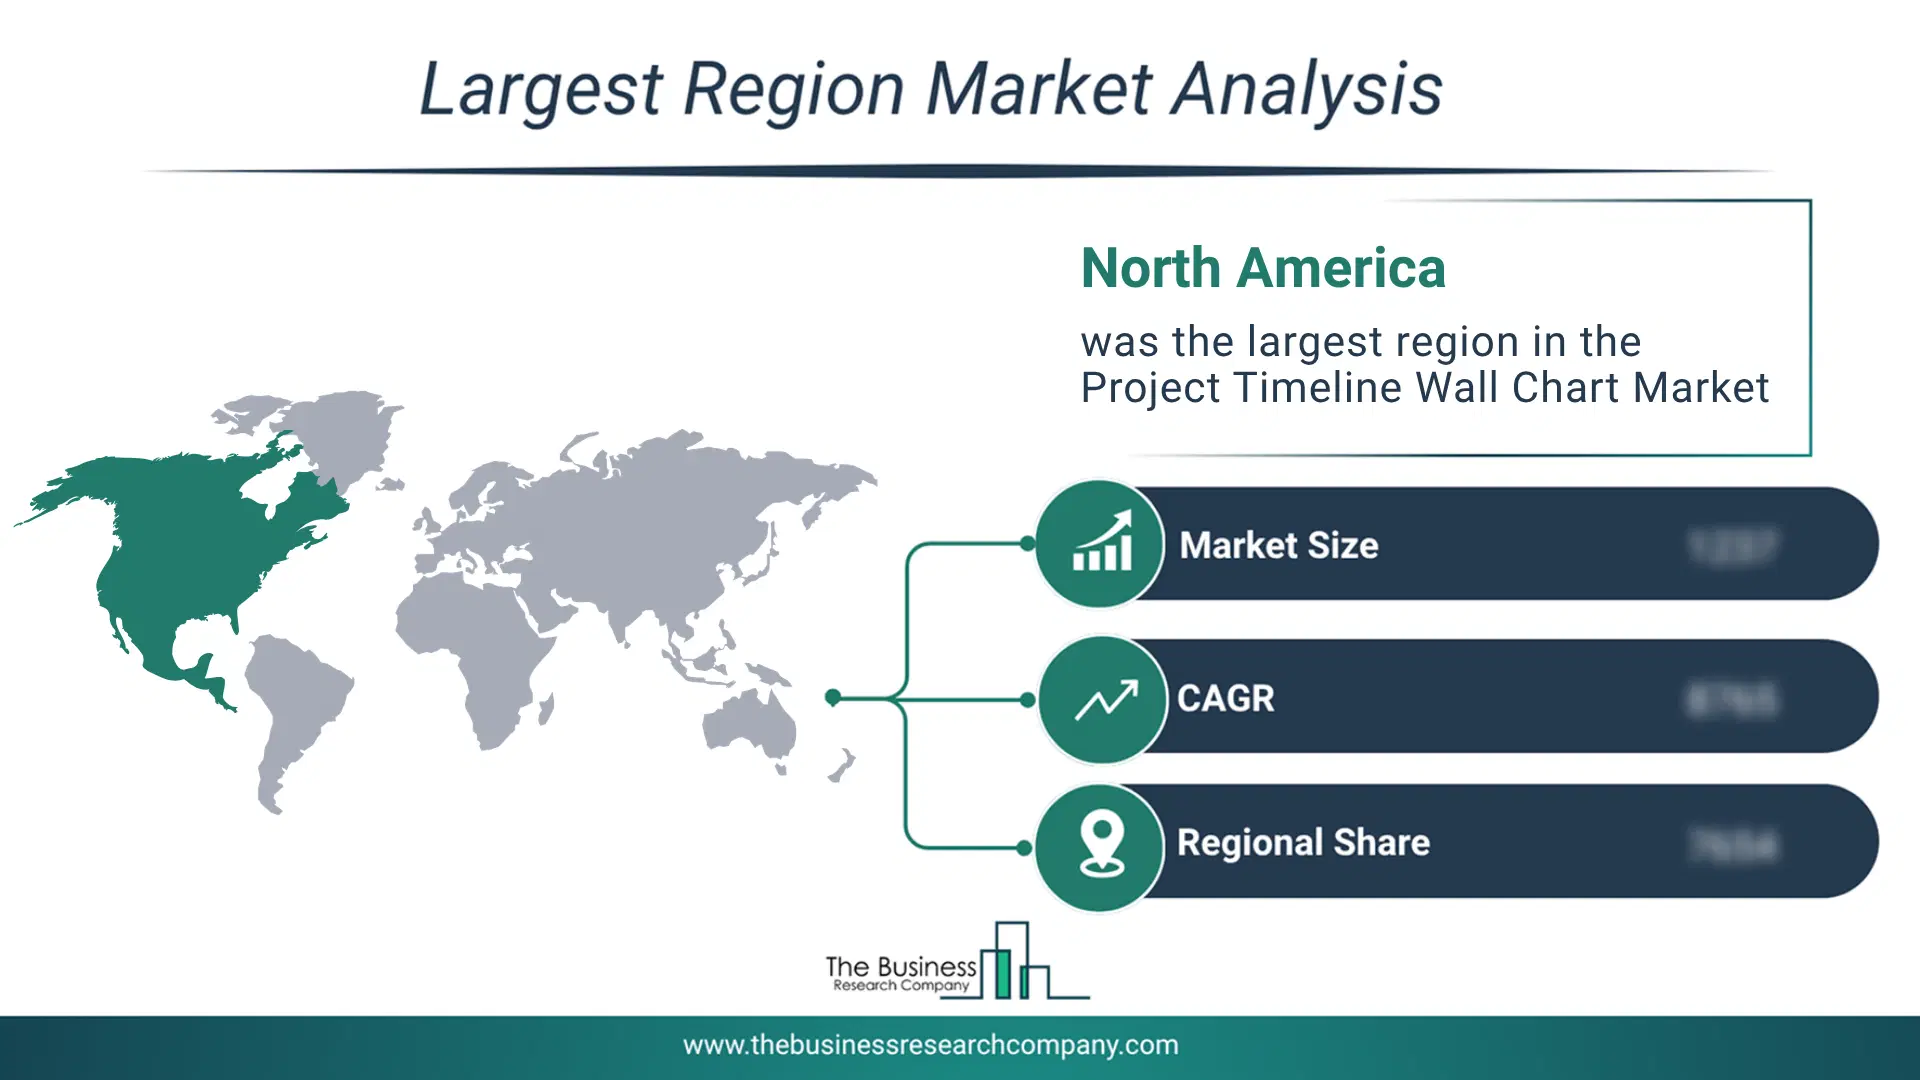
Regional Outlook
North America was the largest region in the project timeline wall chart market in 2025. Asia-Pacific is expected to be the fastest-growing region in the forecast period. The regions covered in this market report are Asia-Pacific, South East Asia, Western Europe, Eastern Europe, North America, South America, Middle East, Africa. The countries covered in this market report are Australia, Brazil, China, France, Germany, India, Indonesia, Japan, Taiwan, Russia, South Korea, UK, USA, Canada, Italy, Spain.What Defines the Project Timeline Wall Chart Market?
The project timeline wall chart market consists of sales of milestone tracking charts, project scheduling boards, task progress planners, resource allocation charts, workflow management boards, project roadmap displays, and deadline tracking charts. Values in this market are ‘factory gate’ values, that is, the value of goods sold by the manufacturers or creators of the goods, whether to other entities (including downstream manufacturers, wholesalers, distributors, and retailers) or directly to end customers. The value of goods in this market includes related services sold by the creators of the goods.How is Market Value Defined and Measured?
The market value is defined as the revenues that enterprises gain from the sale of goods and/or services within the specified market and geography through sales, grants, or donations in terms of the currency (in USD unless otherwise specified). The revenues for a specified geography are consumption values that are revenues generated by organizations in the specified geography within the market, irrespective of where they are produced. It does not include revenues from resales along the supply chain, either further along the supply chain or as part of other products.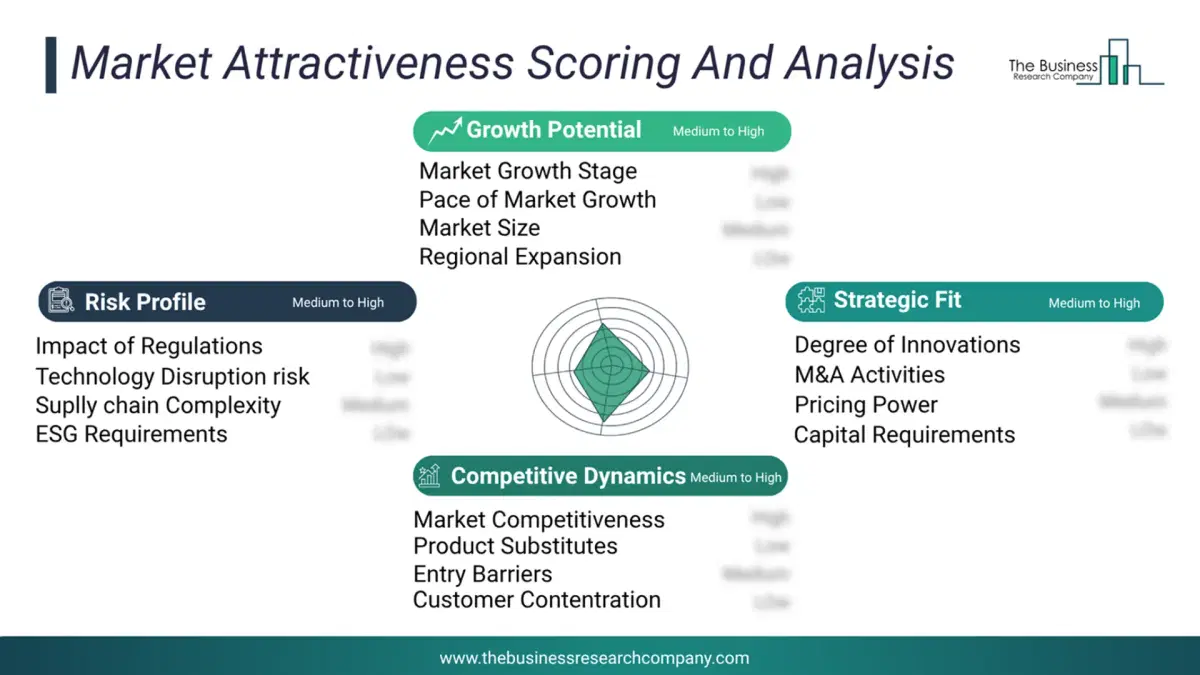
This chart presents market attractiveness based on a quantitative evaluation of growth, competition, strategic alignment, and risk, offering a clear view of opportunity areas for decision-making. This chart is for illustrative purposes; the full report contains the complete analysis.
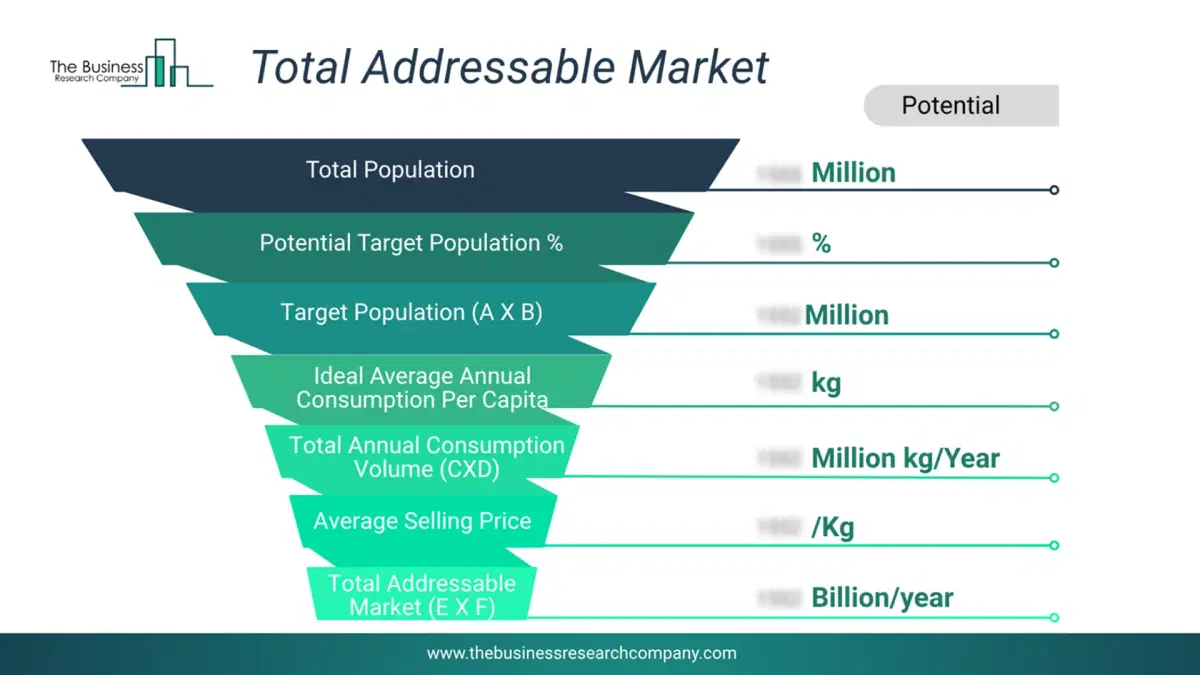
This chart highlights the Total Addressable Market (TAM) by estimating the maximum revenue opportunity using an assumption-driven approach, supporting strategic planning and opportunity sizing across markets. The chart is illustrative; the full report provides a more comprehensive analysis.
What Key Data and Analysis Are Included in the Project Timeline Wall Chart Market Report 2026?
The project timeline wall chart market research report is one of a series of new reports from The Business Research Company that provides market statistics, including industry global market size, regional shares, competitors with the market share, detailed market segments, market trends and opportunities, and any further data you may need to thrive in the project timeline wall chart industry. The market research report delivers a complete perspective of everything you need, with an in-depth analysis of the current and future state of the industry.Project Timeline Wall Chart Market Report Forecast Analysis
| Report Attribute | Details |
|---|---|
| Market Size Value In 2026 | $1.38 billion |
| Revenue Forecast In 2030 | $1.93 billion |
| Growth Rate | CAGR of 8.7% from 2026 to 2030 |
| Base Year For Estimation | 2025 |
| Actual Estimates/Historical Data | 2020-2025 |
| Forecast Period | 2026 - 2030 |
| Market Representation | Revenue in USD Billion and CAGR from 2026 to 2030 |
| Segments Covered | Product Type, Material, Distribution Channel, Application |
| Regional Scope | Asia-Pacific, Western Europe, Eastern Europe, North America, South America, Middle East, Africa |
| Country Scope | The countries covered in the report are Australia, Brazil, China, France, Germany, India, Indonesia, Japan, Taiwan, Russia, South Korea, UK, USA, Canada, Italy, Spain. |
| Key Companies Profiled | Staples Inc, Kokuyo Co Ltd, ACCO Brands Corporation, Mural Technologies Inc, Legamaster International BV, Ghent Manufacturing Inc, Genially Web SL, Pragati Systems, U Brands LLC, Logovisual Ltd, Viz-Pro Group, FRANKEN GmbH, ORGATEX GmbH & Co KG, Deli Group Co Ltd, Scribbledo LLC, Easy WebContent Inc, The Magnet Shop Limited, Taizhou Hualong Office Products Co Ltd, Cadence Management Corporation BV, Piktochart Sdn Bhd, Asana Inc, Monday.com Ltd, Atlassian Corporation, Avery Products Corporation, Magnetic North AB |
| Customization Scope | Request for Customization |
| Pricing And Purchase Options | Explore Purchase Options |