

Satellite Monitoring For Power Assets Market Report 2026
Global Outlook – By Component (Hardware, Software, Services), By Technology (Optical Imaging, Synthetic Aperture Radar, Thermal Imaging, Other Technologies), By Asset Type (Transmission Lines, Distribution Lines, Substations, Power Plants, Renewable Energy Assets), By Application (Asset Planning, Asset Management, Operational Risk Management), By End User (Utility Companies, Independent Power Producers, Industrial, Other End Users ) – Market Size, Trends, Strategies, and Forecast to 2030
Satellite Monitoring For Power Assets Market Overview
• Satellite Monitoring For Power Assets market size has reached to $1.89 billion in 2025 • Expected to grow to $3.53 billion in 2030 at a compound annual growth rate (CAGR) of 13.3% • Growth Driver: Expansion Of Electric Power Generation Driving The Market Adoption Due To Increasing Power Infrastructure Requiring Real-Time Monitoring And Efficient Asset Management • Market Trend: AI-Powered Satellite Analytics Innovations Driving Infrastructure Resilience And Climate Risk Management • North America was the largest region in 2025 and Asia-Pacific is the fastest growing region.What Is Covered Under Satellite Monitoring For Power Assets Market?
Satellite monitoring for power assets is the use of satellite-based observation technologies and data analysis techniques to remotely track, assess, and monitor the condition of power infrastructure. It enables enhanced visibility into asset performance, environmental conditions, and potential risks through accurate and continuous data collection from space-based systems. The main components of satellite monitoring for power assets include hardware, software, and services. Hardware refers to physical satellite-based equipment and supporting systems used to capture and collect data for monitoring power infrastructure and assets. These solutions use optical imaging, synthetic aperture radar, thermal imaging, and other technologies and are used to monitor transmission lines, distribution lines, substations, power plants, and renewable energy assets. The key applications are asset planning, asset management, and operational risk management, while the end users include utility companies, independent power producers, industrial users, and others.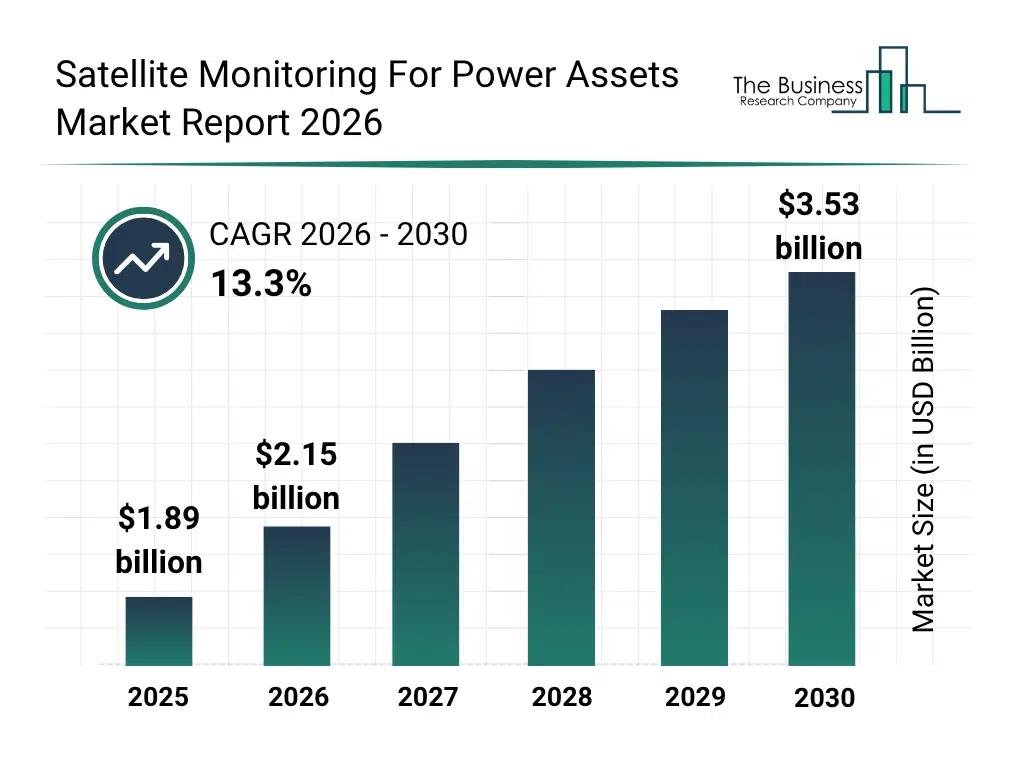
What Is The Satellite Monitoring For Power Assets Market Size and Share 2026?
The satellite monitoring for power assets market size has grown rapidly in recent years. It will grow from $1.89 billion in 2025 to $2.15 billion in 2026 at a compound annual growth rate (CAGR) of 13.7%. The growth in the historic period can be attributed to increasing need for remote power infrastructure inspection, rising power transmission and distribution networks, growing frequency of infrastructure-related disruptions, increasing demand for asset condition assessment, rising need to monitor geographically dispersed power assets.What Is The Satellite Monitoring For Power Assets Market Growth Forecast?
The satellite monitoring for power assets market size is expected to see rapid growth in the next few years. It will grow to $3.53 billion in 2030 at a compound annual growth rate (CAGR) of 13.3%. The growth in the forecast period can be attributed to growing demand for predictive power asset monitoring, increasing need for continuous infrastructure risk assessment, rising deployment of renewable energy assets, expanding power grid infrastructure, increasing demand for cost-efficient remote inspection solutions. Major trends in the forecast period include increasing adoption of satellite-based power asset monitoring, rising demand for continuous remote infrastructure inspection, growing preference for high-resolution satellite imagery for asset assessment, increasing demand for early detection of power infrastructure risks, rising adoption of satellite monitoring for geographically remote power assets.
Global Satellite Monitoring For Power Assets Market Segmentation
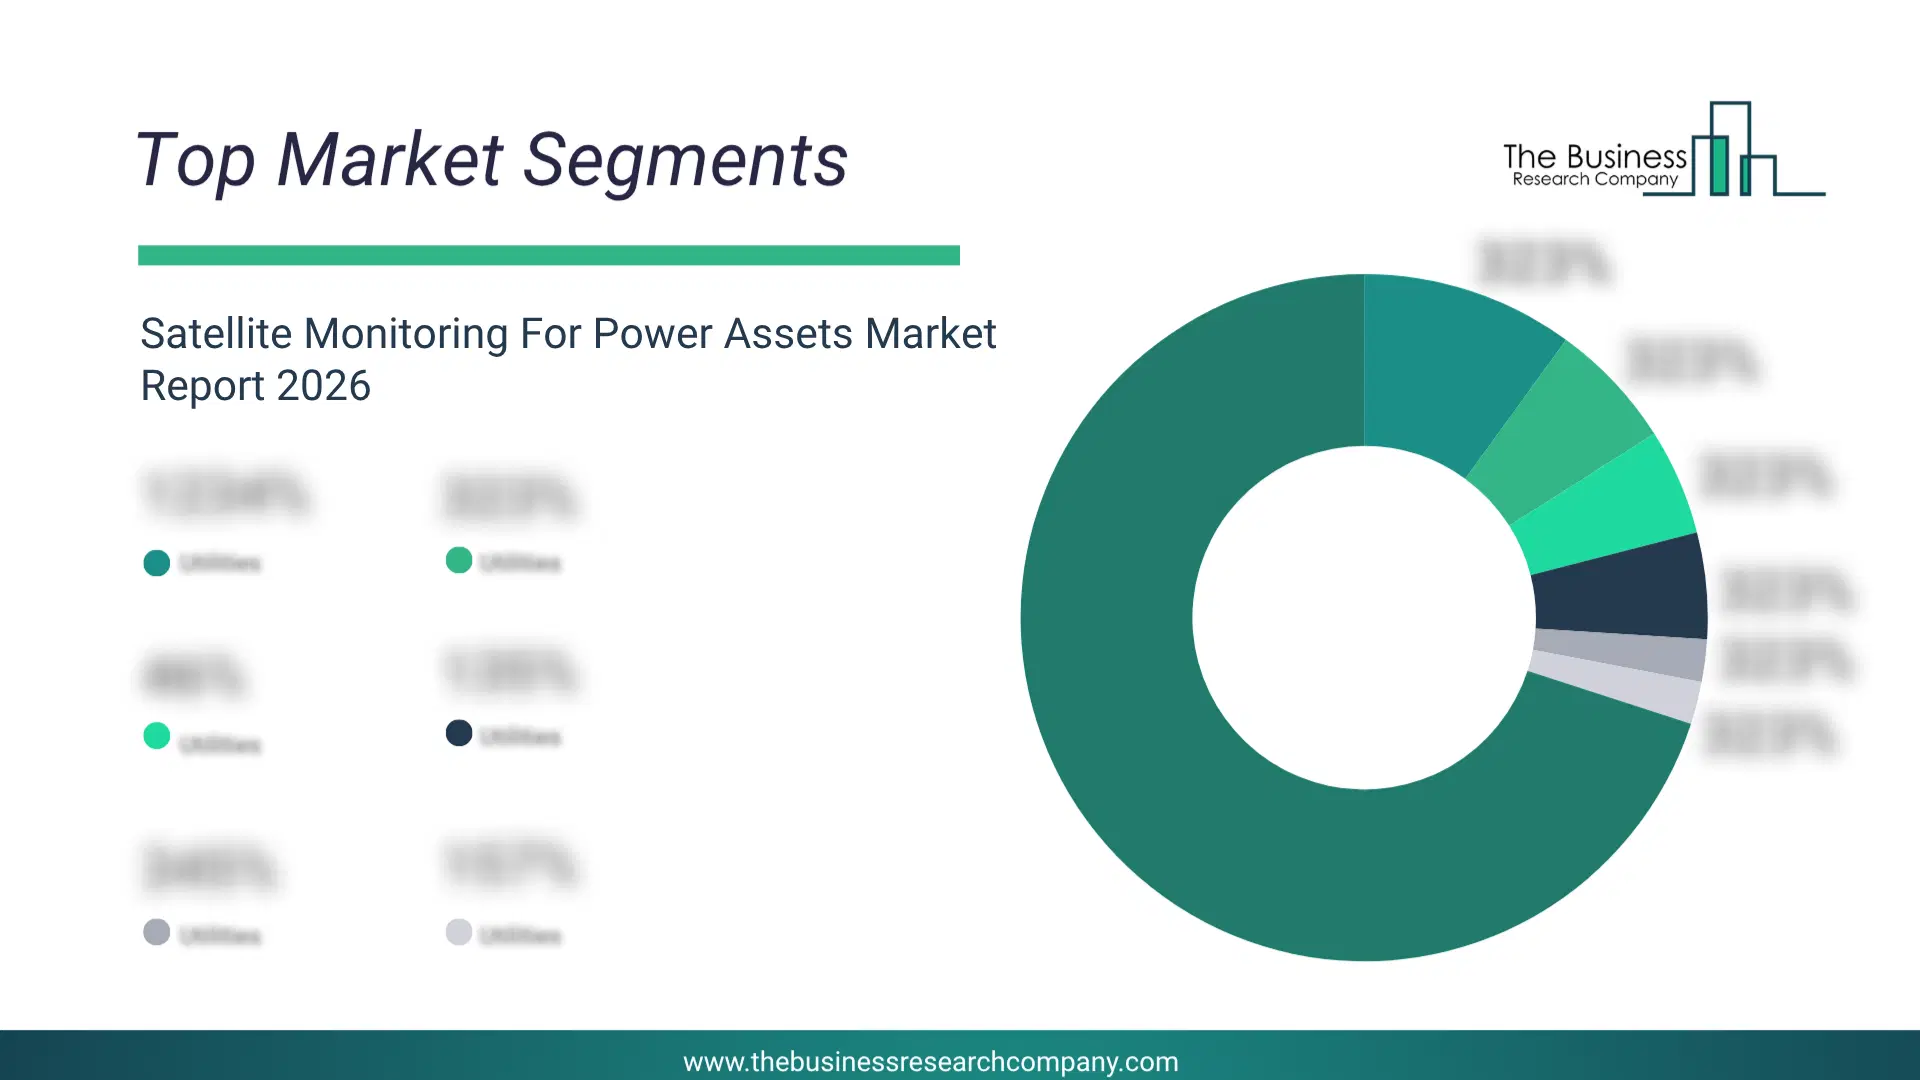
1) By Component: Hardware, Software, Services 2) By Technology: Optical Imaging, Synthetic Aperture Radar, Thermal Imaging, Other Technologies 3) By Asset Type: Transmission Lines, Distribution Lines, Substations, Power Plants, Renewable Energy Assets 4) By Application: Asset Planning, Asset Management, Operational Risk Management 5) By End User: Utility Companies, Independent Power Producers, Industrial, Other End Users Subsegments: 1) By Hardware: Satellite Imaging Systems, Remote Sensing Equipment, Ground Receiving Stations, Data Acquisition Devices, Communication Equipment, Navigation And Positioning Systems 2) By Software: Geospatial Analytics Software, Image Processing Software, Asset Monitoring Platforms, Artificial Intelligence And Machine Learning Software, Data Visualization Software, Geographic Information Systems Software 3) By Services: Satellite Data Acquisition Services, Data Processing And Analysis Services, Asset Inspection And Monitoring Services, Predictive Maintenance Services, Consulting And Advisory Services, Managed Monitoring ServicesWhat Are The Drivers Of The Satellite Monitoring For Power Assets Market?
The expansion of electric power generation is expected to propel the growth of the satellite monitoring for power assets market going forward. Electric power generation refers to the production of electricity by transforming different energy sources into usable electrical power through generation technologies such as turbines, generators, and renewable energy systems. Electric power generation is increasing due to rising electricity demand from industrial expansion and urban development, as growing populations, businesses, and infrastructure require a continuous and reliable supply of electricity. Electric power generation drives the adoption of satellite monitoring for power assets by expanding the number of power infrastructure assets that require continuous remote monitoring, enabling operators to detect issues, improve maintenance planning, and ensure a reliable electricity supply. For instance, in January 2024, according to the Energy Information Administration, a US-based agency of the federal statistical system, U.S. solar power generation is forecast to jump 75%, expanding from 163 billion kWh in 2023 to 286 billion kWh by 2025. Therefore, the expansion of electric power generation is driving the growth of the satellite monitoring for power assets industry. The rising investments in renewable energy projects are expected to propel the growth of the satellite monitoring for power assets market going forward. Investments in renewable energy projects refer to financial commitments made to build, upgrade, and operate renewable energy facilities that generate electricity from sources such as sunlight, wind, and water. Investments in renewable energy projects are increasing due to growing demand for clean energy, as governments and industries are investing in solar, wind, and other renewable sources to reduce carbon emissions and meet sustainability targets. Investments in renewable energy projects support satellite monitoring for power assets by increasing the need for advanced monitoring solutions to track the performance, condition, and operational efficiency of expanding solar, wind, and other renewable energy infrastructure. For instance, in December 2025, according to the Visual Capitalist, a Canada-based media and data visualization company, in 2024, global spending on renewable energy increased to $807 billion, up from an average of $662 billion between 2022 and 2023. Therefore, the rising investments in renewable energy projects are driving the growth of the satellite monitoring for power assets industry.Key Players In The Global Satellite Monitoring For Power Assets Market
Major companies operating in the satellite monitoring for power assets market are Airbus SE, Hexagon AB, Fugro N.V., NV5 Geospatial Solutions Inc, Planet Labs PBC, GMV Innovating Solutions S.L., ICEYE Oy, Capella Space Corporation, BlackSky Technology Inc, EOS Data Analytics Inc, GAF AG, GHGSat Inc, Synspective Inc, SpaceKnow Inc, Kayrros SAS, Satellogic Inc, GeoVille Informationssysteme GmbH, SatSure Analytics India Pvt. Ltd., SI Imaging Services Co. Ltd., Satellite Vu Ltd, Pixxel Space Technologies Pvt. Ltd., Geocento Ltd, EOMAP GmbH & Co. KG, Sarmap SA, Planetek Italia S.r.l., PlanetIQ, Ursa Space Systems Inc, 3vGeomatics Inc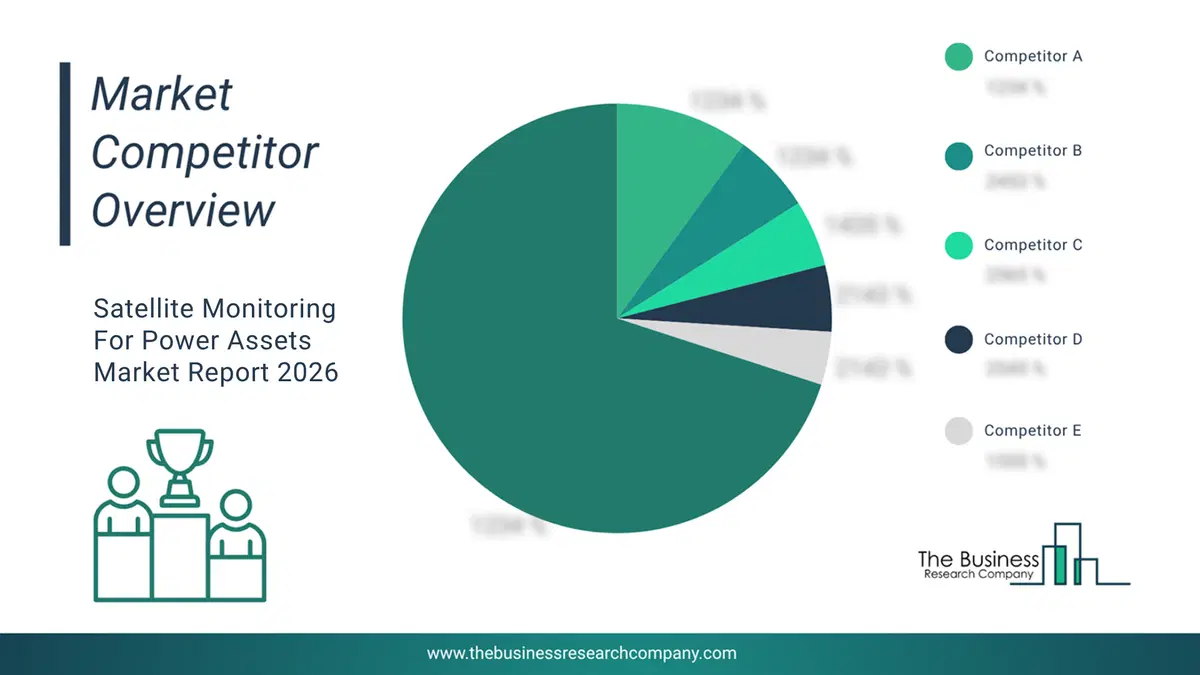
This chart is for illustrative purposes; the full report includes a detailed competitor analysis and comprehensive overview of the top 10 companies in the market.
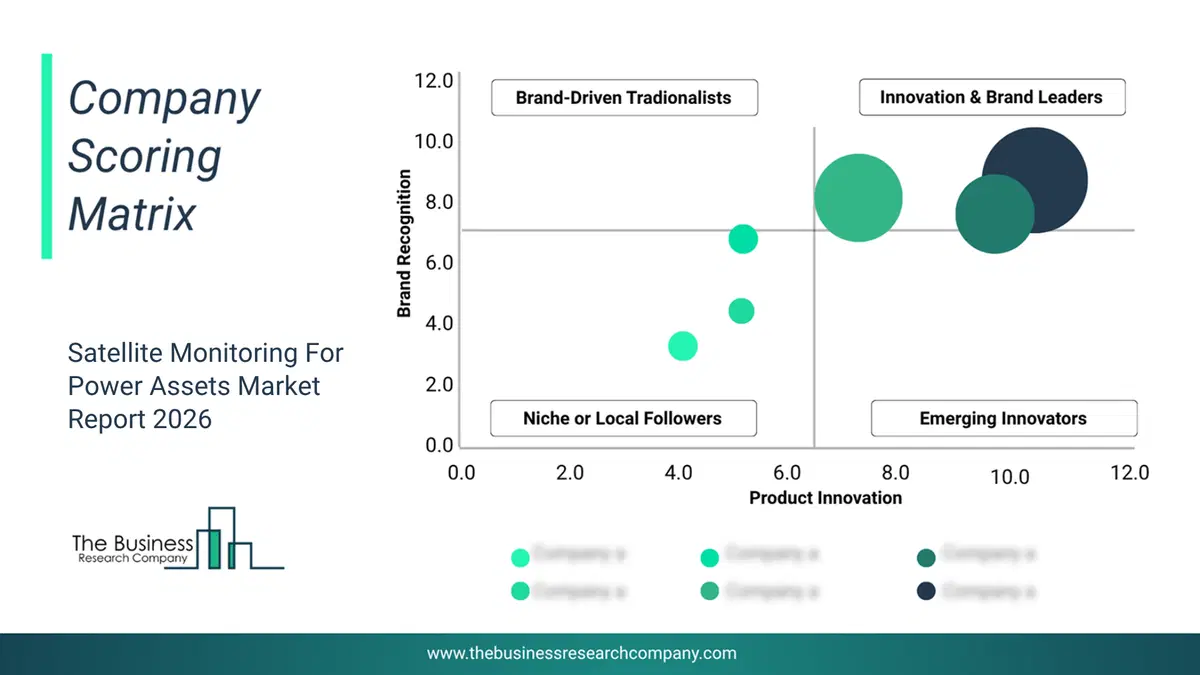
This chart maps companies by product innovation and brand strength, with bubble size indicating relative revenue, helping identify market leaders, challengers, and niche players. This is an illustrative chart; the full report provides a complete and accurate competitive analysis.
Global Satellite Monitoring For Power Assets Market Trends and Insights
Major companies operating in the satellite monitoring for power assets market are focusing on developing innovative solutions, such as AI-powered satellite analytics platforms to improve infrastructure monitoring, enhance predictive maintenance capabilities, and support climate risk management for power asset operators. AI-powered satellite analytics platforms refer to technology solutions that combine satellite imagery, artificial intelligence algorithms, and data analytics to generate actionable insights for monitoring and assessing infrastructure conditions. For instance, in June 2024, LiveEO, a Germany-based technology company, raised $0.03 billion (€25 million) in a Series B funding round to accelerate the development of its AI-powered satellite data solutions for critical infrastructure and climate risk management. The solution is designed to transform high-resolution satellite data into automated insights for detecting infrastructure risks, monitoring environmental changes, and improving asset resilience. It offers benefits such as real-time risk identification, improved operational efficiency, and enhanced climate resilience. The investment aims to help customers strengthen infrastructure management while supporting the growing adoption of AI-driven monitoring technologies and sustainable asset management practices.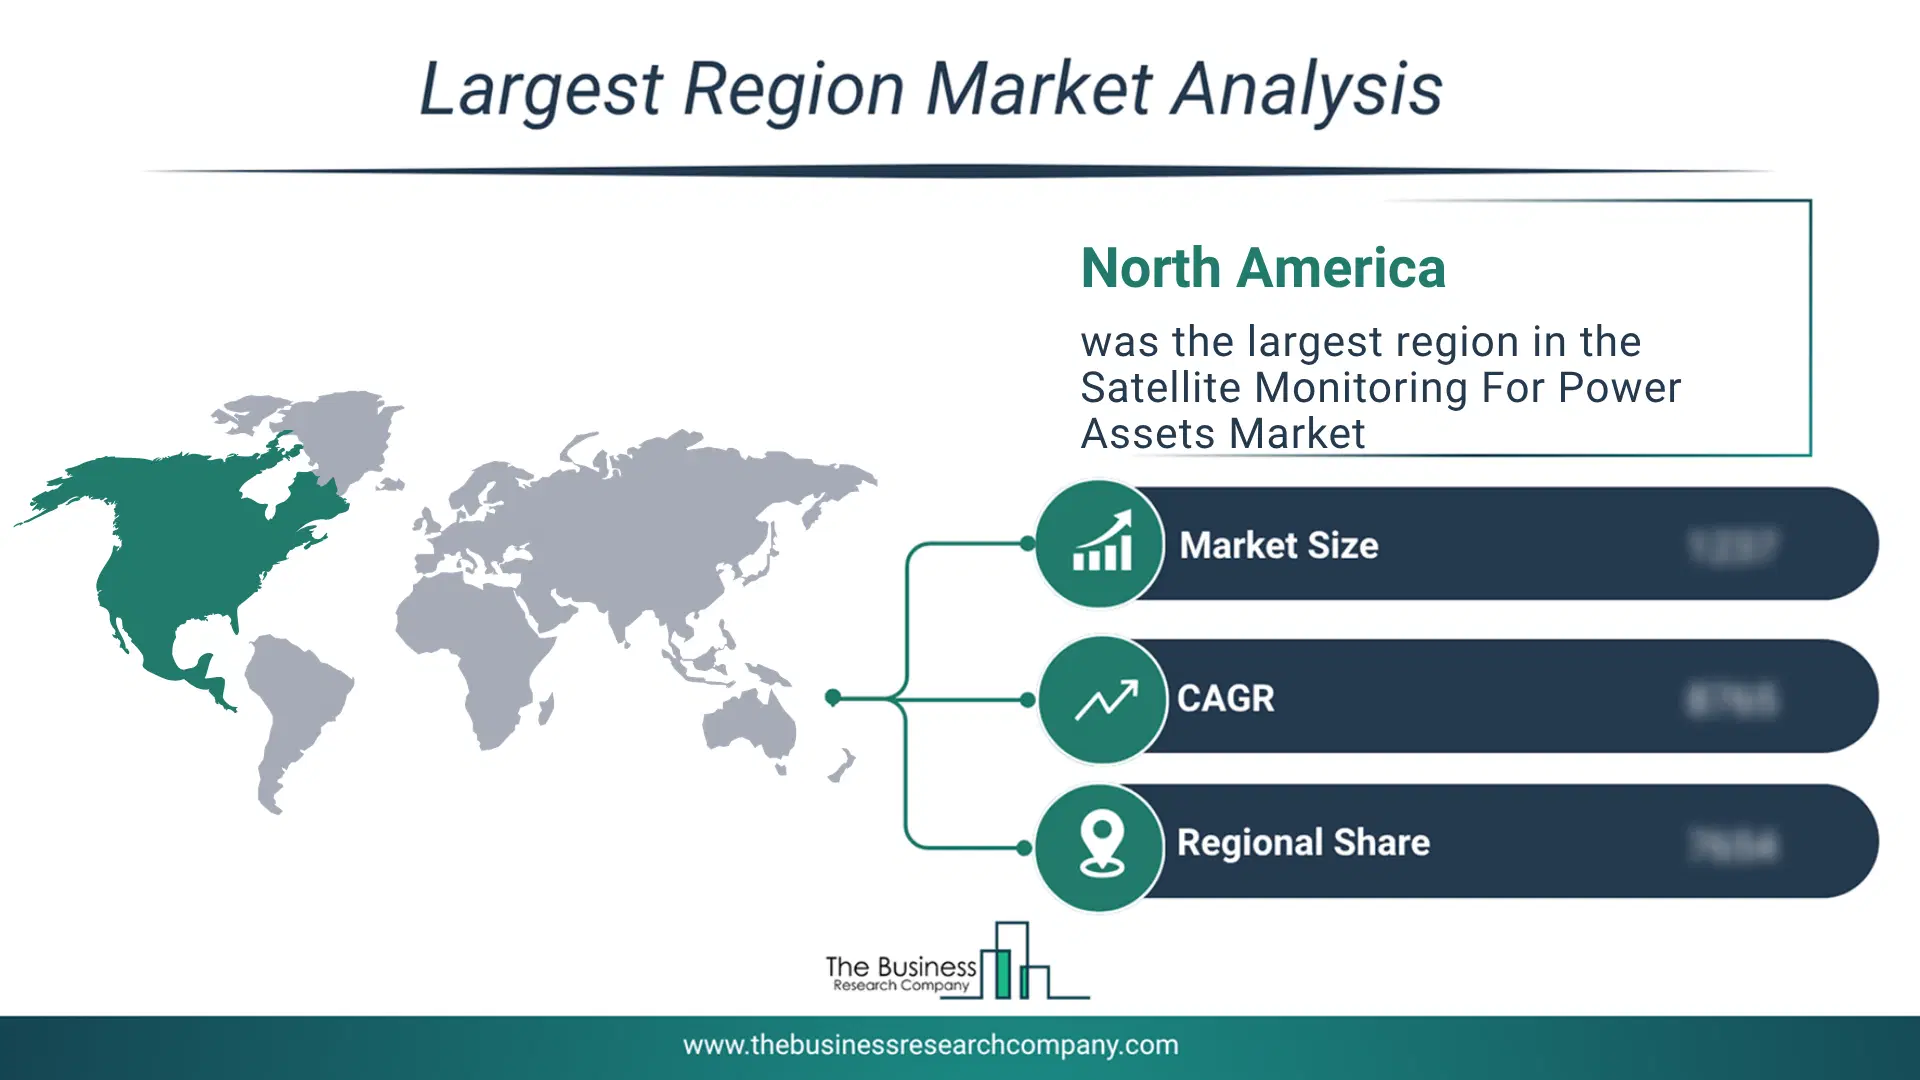
Regional Outlook
North America was the largest region in the satellite monitoring for power assets market in 2025. Asia-Pacific is expected to be the fastest-growing region in the forecast period. The regions covered in this market report are Asia-Pacific, South East Asia, Western Europe, Eastern Europe, North America, South America, Middle East, Africa. The countries covered in this market report are Australia, Brazil, China, France, Germany, India, Indonesia, Japan, Taiwan, Russia, South Korea, UK, USA, Canada, Italy, Spain.What Defines the Satellite Monitoring For Power Assets Market?
The satellite monitoring for power assets market consists of revenues earned by entities by providing services such as remote asset inspection, infrastructure condition monitoring, vegetation encroachment monitoring, and fault detection and identification. The market value includes the value of related goods sold by the service provider or included within the service offering. The satellite monitoring for power assets market also includes sales of satellite-based asset monitoring systems, vegetation encroachment monitoring systems, and predictive maintenance analytics systems. Values in this market are ‘factory gate’ values, that is, the value of goods sold by the manufacturers or creators of the goods, whether to other entities (including downstream manufacturers, wholesalers, distributors, and retailers) or directly to end customers. The value of goods in this market includes related services sold by the creators of the goods.How is Market Value Defined and Measured?
The market value is defined as the revenues that enterprises gain from the sale of goods and/or services within the specified market and geography through sales, grants, or donations in terms of the currency (in USD unless otherwise specified). The revenues for a specified geography are consumption values that are revenues generated by organizations in the specified geography within the market, irrespective of where they are produced. It does not include revenues from resales along the supply chain, either further along the supply chain or as part of other products.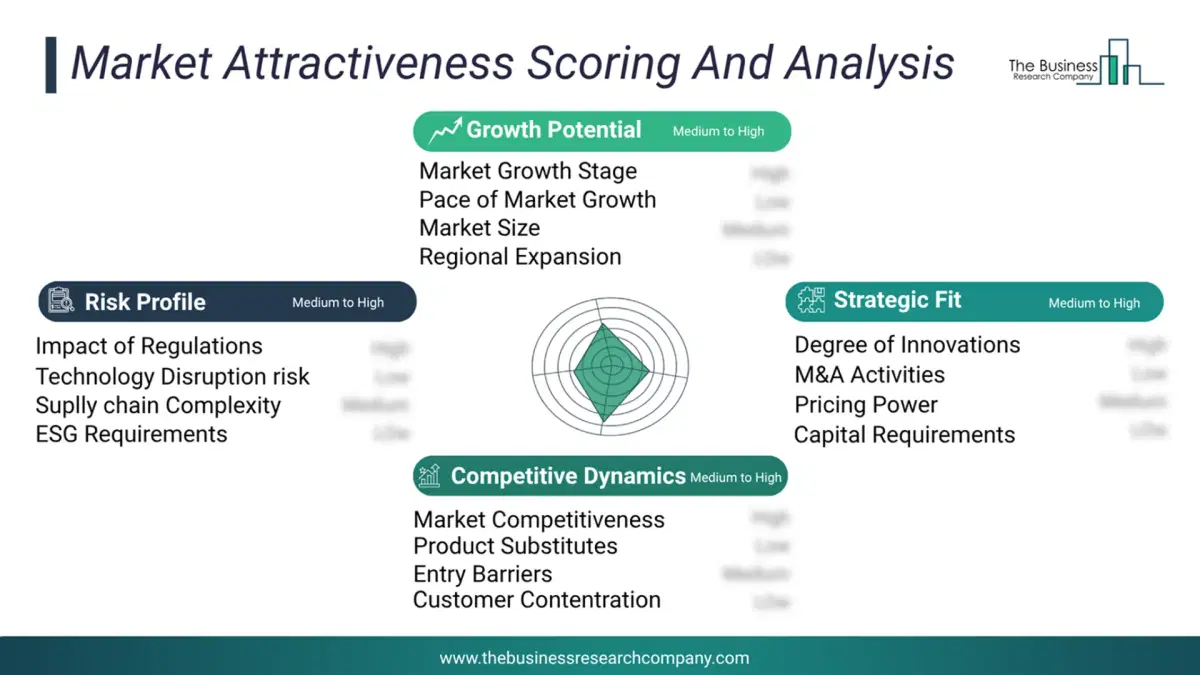
This chart presents market attractiveness based on a quantitative evaluation of growth, competition, strategic alignment, and risk, offering a clear view of opportunity areas for decision-making. This chart is for illustrative purposes; the full report contains the complete analysis.
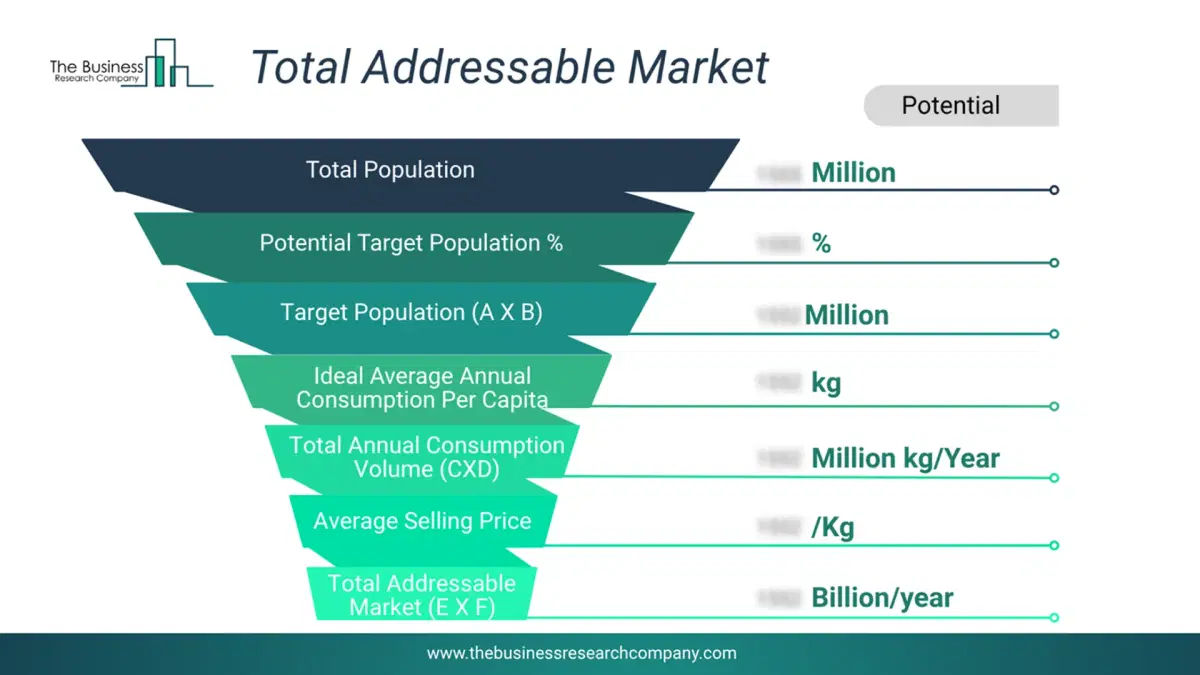
This chart highlights the Total Addressable Market (TAM) by estimating the maximum revenue opportunity using an assumption-driven approach, supporting strategic planning and opportunity sizing across markets. The chart is illustrative; the full report provides a more comprehensive analysis.
What Key Data and Analysis Are Included in the Satellite Monitoring For Power Assets Market Report 2026?
The satellite monitoring for power assets market research report is one of a series of new reports from The Business Research Company that provides market statistics, including industry global market size, regional shares, competitors with the market share, detailed market segments, market trends and opportunities, and any further data you may need to thrive in the satellite monitoring for power assets industry. The market research report delivers a complete perspective of everything you need, with an in-depth analysis of the current and future state of the industry.Satellite Monitoring For Power Assets Market Report Forecast Analysis
| Report Attribute | Details |
|---|---|
| Market Size Value In 2026 | $2.15 billion |
| Revenue Forecast In 2030 | $3.53 billion |
| Growth Rate | CAGR of 13.3% from 2026 to 2030 |
| Base Year For Estimation | 2025 |
| Actual Estimates/Historical Data | 2020-2025 |
| Forecast Period | 2026 - 2030 |
| Market Representation | Revenue in USD Billion and CAGR from 2026 to 2030 |
| Segments Covered | Component, Technology, Asset Type, Application, End User |
| Regional Scope | Asia-Pacific, Western Europe, Eastern Europe, North America, South America, Middle East, Africa |
| Country Scope | The countries covered in the report are Australia, Brazil, China, France, Germany, India, Indonesia, Japan, Taiwan, Russia, South Korea, UK, USA, Canada, Italy, Spain. |
| Key Companies Profiled | Airbus SE, Hexagon AB, Fugro N.V., NV5 Geospatial Solutions Inc, Planet Labs PBC, GMV Innovating Solutions S.L., ICEYE Oy, Capella Space Corporation, BlackSky Technology Inc, EOS Data Analytics Inc, GAF AG, GHGSat Inc, Synspective Inc, SpaceKnow Inc, Kayrros SAS, Satellogic Inc, GeoVille Informationssysteme GmbH, SatSure Analytics India Pvt. Ltd., SI Imaging Services Co. Ltd., Satellite Vu Ltd, Pixxel Space Technologies Pvt. Ltd., Geocento Ltd, EOMAP GmbH & Co. KG, Sarmap SA, Planetek Italia S.r.l., PlanetIQ, Ursa Space Systems Inc, 3vGeomatics Inc |
| Customization Scope | Request for Customization |
| Pricing And Purchase Options | Explore Purchase Options |