

Smart infrastructure Market Report 2026
Global Outlook – By Component (Hardware, Software, Services), By Type (Smart Transportation System, Smart Energy Management System, Smart Safety And Security Systems, Smart Waste Management Solutions, Other Types), By Technology (Internet Of Things (IoT), Artificial Intelligence And Analytics, Cloud Computing, Edge Computing, Digital Twin, Blockchain), By Application (Energy Management, Traffic And Mobility Management, Building Automation, Safety And Security Management, Environmental Monitoring, Utility Management), By End User (Government And Municipalities, Utilities, Transportation Authorities, Commercial Enterprises, Industrial Sector, Residential Sector) – Market Size, Trends, Strategies, and Forecast to 2030
Smart infrastructure Market Overview
• Smart infrastructure market size has reached to $492.55 billion in 2025 • Expected to grow to $1224.41 billion in 2030 at a compound annual growth rate (CAGR) of 20% • Growth Driver: Rising 5G Adoption Driving Growth In The Market Due To Enhanced Connectivity, Low Latency, And Advanced Digital Applications • Market Trend: Leading Companies Driving Digital Transformation In Infrastructure With Cloud And IoT Solutions • North America was the largest region in 2025 and Asia-Pacific is the fastest growing region.Market Gains By 2030 – Top Opportunities By Segment
Market Gain identifies the most promising market opportunities by highlighting the segments or products expected to generate the highest incremental revenue growth over the next five years.
What Is Covered Under Smart infrastructure Market?
Smart infrastructure refers to physical and digital systems that use connected technologies such as sensors, data networks, automation, and analytics to monitor, manage, and optimize the performance of infrastructure in real time. It enables more efficient, reliable, and sustainable operation of assets like transportation, energy, water, buildings, and communications by supporting data-driven decision-making and adaptive control. The main components of smart infrastructure market include hardware, software, and services. Hardware refers to sensors, communication devices, smart meters, and control systems that enable data-driven monitoring and automation of infrastructure assets. These are categorized into types including Smart Transportation system, smart energy management system, smart safety and security systems, smart waste management solutions, and other types and are enabled by technologies including internet of things (IoT), artificial intelligence and analytics, cloud computing, edge computing, digital twin, and blockchain. These are used for applications including energy management, traffic and mobility management, building automation, safety and security management, environmental monitoring, and utility management and are adopted by government and municipalities, utilities, transportation authorities, commercial enterprises, industrial sector, and residential sector.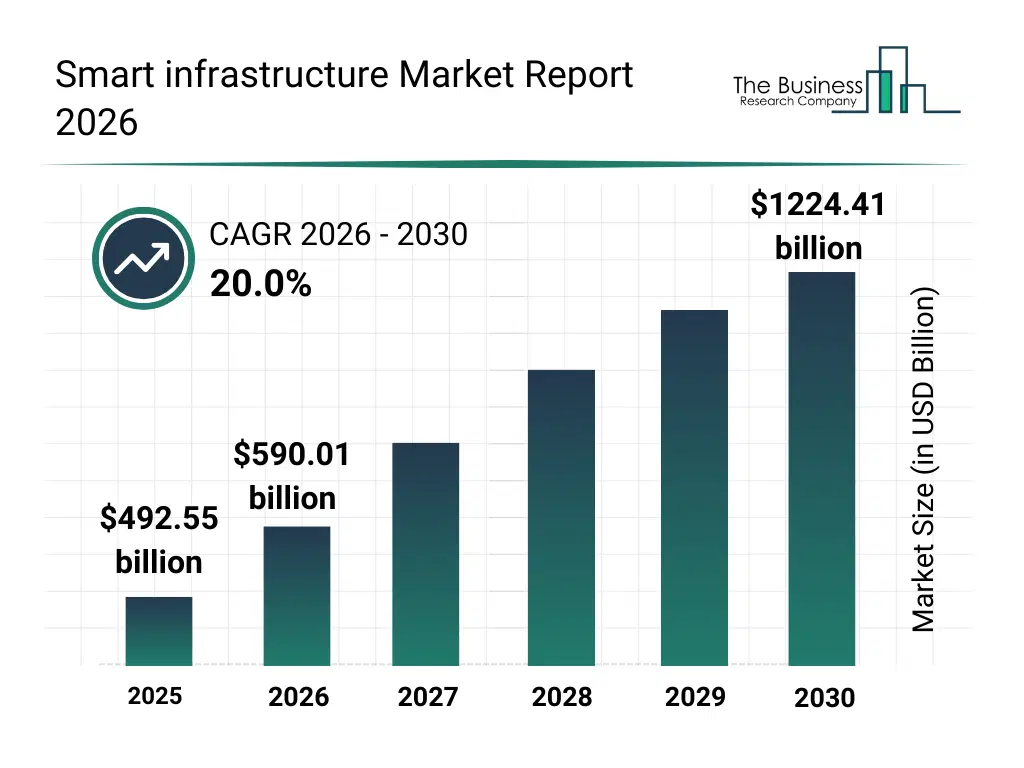
What Is The Smart infrastructure Market Size and Share 2026?
The smart infrastructure market size has grown rapidly in recent years. It will grow from $492.55 billion in 2025 to $590.01 billion in 2026 at a compound annual growth rate (CAGR) of 19.8%. The growth in the historic period can be attributed to increasing urbanization and infrastructure development, rising demand for energy-efficient systems, adoption of IoT-enabled monitoring solutions, growing government initiatives for Smart Cities, increasing need for real-time infrastructure analytics.What Is The Smart infrastructure Market Growth Forecast?
The smart infrastructure market size is expected to see exponential growth in the next few years. It will grow to $1224.41 billion in 2030 at a compound annual growth rate (CAGR) of 20.0%. The growth in the forecast period can be attributed to growing investment in AI-driven infrastructure optimization, rising deployment of edge computing and cloud-based monitoring, increasing integration of smart safety and security systems, expansion of environmental monitoring and utility management, growing adoption of blockchain for infrastructure data management. Major trends in the forecast period include increasing adoption of predictive maintenance solutions, rising demand for smart metering and energy management, growing integration of digital twin platforms, expansion of traffic and mobility management systems, rising focus on system integration and managed services.
Global Smart infrastructure Market Segmentation
1) By Component: Hardware, Software, Services 2) By Type: Smart Transportation System, Smart Energy Management System, Smart Safety And Security Systems, Smart Waste Management Solutions, Other Types 3) By Technology: Internet Of Things (IoT), Artificial Intelligence And Analytics, Cloud Computing, Edge Computing, Digital Twin, Blockchain 4) By Application: Energy Management, Traffic And Mobility Management, Building Automation, Safety And Security Management, Environmental Monitoring, Utility Management 5) By End User: Government And Municipalities, Utilities, Transportation Authorities, Commercial Enterprises, Industrial Sector, Residential Sector Subsegments: 1) By Hardware: Sensors, Actuators, Controllers And Gateways, Edge Devices, Networking Equipment, Smart Meters 2) By Software: IoT Platforms, Analytics And AI Software, Building Management Software, Energy Management Software, Traffic And Mobility Management Software, Security And Surveillance Software, Digital Twin Platforms 3) By Services: Consulting And Advisory Services, System Integration Services, Managed Services, Maintenance And Support Services, Training And Education Services The top segments in the smart infrastructure market will be: • Hardware will reach $309.27 Billion by 2030. • Software will reach $227.55 Billion by 2030. • Services will reach $151.19 Billion by 2030.What Is The Driver Of The Smart infrastructure Market?
The growing adoption of 5G is expected to propel the growth of the smart infrastructure market going forward. 5G adoption refers to the widespread deployment and use of 5G networks and devices to enable faster connectivity, ultra-low latency, and enhanced digital experiences. This adoption is driven by 5G’s ability to support real-time communication and high-performance applications such as gaming, autonomous vehicles, smart cities, and industrial automation. As 5G networks expand, there is an increasing need for smart infrastructure, including connected sensors, edge computing systems, intelligent transportation networks, and advanced communication frameworks, to support dense network deployment, optimize performance, and ensure reliable coverage. The rollout of 5G therefore accelerates investments in smart infrastructure to meet these technical and operational requirements. For instance, in May 2025, according to Telefonaktiebolaget LM Ericsson, a Sweden-based information and communication technology company, global 5G subscriptions are expected to increase from 2.9 billion in 2025 to 6.3 billion in 2030. Therefore, the growing adoption of 5G is driving the growth of the smart infrastructure industry.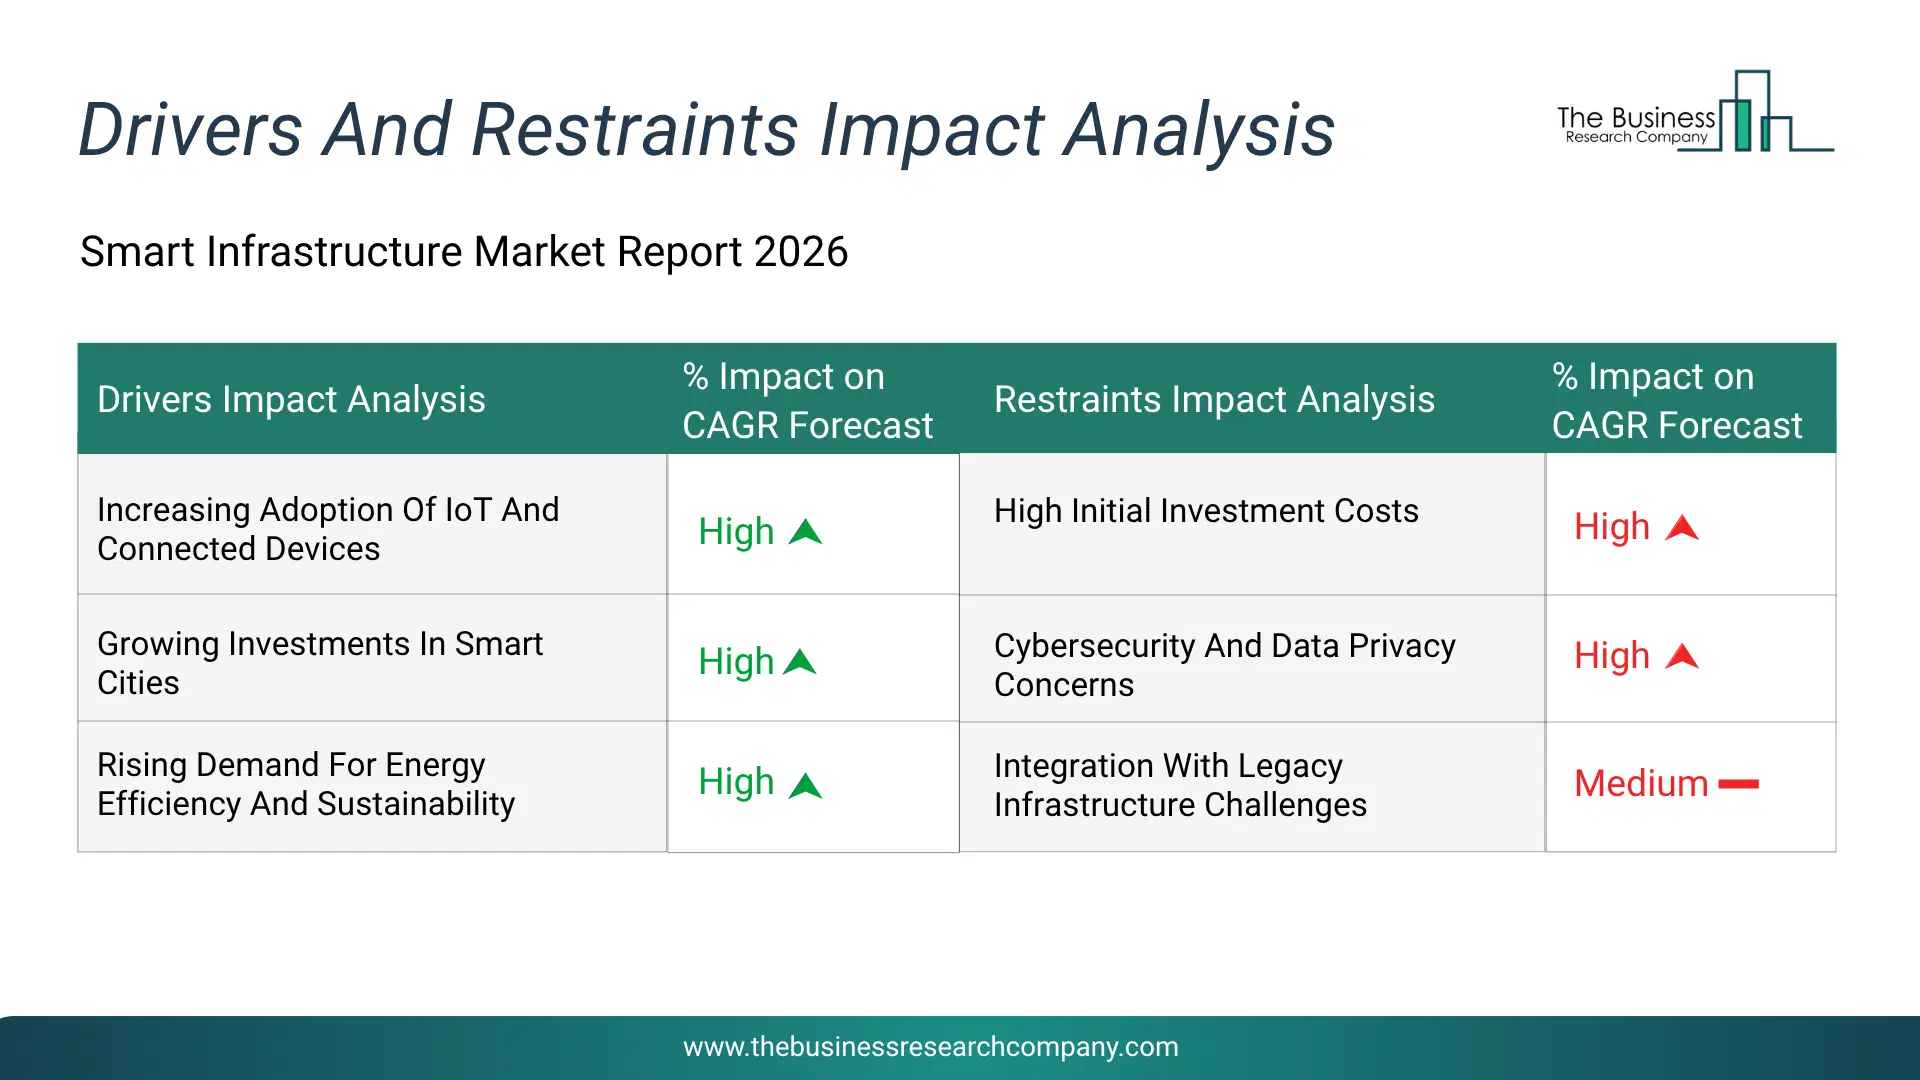
Infographic Chart Showing Key Market Drivers Analysis And Restraints For Smart Infrastructure Market
The chart presents an impact analysis of key drivers and restraints, quantifying their relative influence on the market's growth rate and helping assess the balance between growth enablers and limiting factors. This chart offers a high-level perspective; the full report contains more detailed insights.
How Will The Drivers Impact Growth In The Global Smart Infrastructure Market?
• Increasing Adoption Of IoT And Connected Devices (High) – During the forecast period, the increasing adoption of IoT and connected devices is expected to become a key growth driver for the smart infrastructure market by 2030. Organizations are increasingly deploying sensors, smart meters, and connected equipment to monitor infrastructure assets in real time. These technologies improve operational efficiency, reduce downtime, and enable predictive maintenance. The ability to collect and analyze infrastructure data supports faster decision-making and more effective resource utilization across multiple sectors. As digital connectivity continues to expand, demand for intelligent infrastructure solutions is expected to strengthen. • Growing Investments In Smart Cities (High) – During the forecast period, the growing investments in smart cities are expected to emerge as a major factor driving the expansion of the smart infrastructure market by 2030. Governments and municipalities are prioritizing the deployment of intelligent transportation systems, modern energy networks, and digitally connected public utilities. These infrastructure initiatives improve urban mobility, strengthen service delivery, and enhance the management of rapidly expanding cities. Increased public and private sector funding is accelerating the deployment of advanced infrastructure technologies across both developed and emerging economies. • Rising Demand For Energy Efficiency And Sustainability (High) – During the forecast period, the rising demand for energy efficiency and sustainability is expected to act as a key growth catalyst for the smart infrastructure market by 2030. Industries and public sector organizations are adopting intelligent infrastructure solutions to reduce energy consumption, improve asset performance, and support long-term environmental objectives. Smart grids, automated building systems, and digital monitoring platforms enable more efficient resource management while lowering operational costs. The growing focus on sustainability initiatives and regulatory compliance is further accelerating the deployment of these technologies.How Will The Restraints Impact Growth In The Global Smart Infrastructure Market?
• High Initial Investment Costs (High) – During the forecast period, high initial investment costs act as a major restraint for the smart infrastructure market because deploying smart sensors, communication networks, automation systems, and analytics platforms requires substantial capital expenditure. Many municipalities and organizations face budget constraints that limit their ability to invest in large-scale infrastructure modernization projects. The long payback period associated with these investments can further discourage adoption. Small and developing regions are particularly affected by funding challenges. As a result, market growth is restrained in cost-sensitive environments. • Cybersecurity And Data Privacy Concerns (High) – During the forecast period, cybersecurity and data privacy concerns act as a significant restraint for the smart infrastructure market because interconnected systems and IoT devices are vulnerable to cyberattacks and unauthorized access. Breaches in critical infrastructure networks can disrupt operations and compromise sensitive information. Organizations are increasingly concerned about protecting data and ensuring system reliability. Addressing these risks requires additional investments in cybersecurity measures and regulatory compliance. Consequently, concerns over security and privacy can slow the adoption of smart infrastructure solutions. • Integration With Legacy Infrastructure Challenges (High) – During the forecast period, integration with legacy infrastructure challenges can act as a significant restraint on the smart infrastructure market because many existing transportation, utility, and public infrastructure systems were not designed to support modern digital technologies. Integrating smart sensors, Internet of Things (IoT) devices, cloud platforms, and automation systems with aging infrastructure often requires extensive upgrades, customization, and system interoperability enhancements. These integration challenges can increase implementation complexity, extend project timelines, and raise deployment costs. Organizations may also experience operational disruptions during modernization efforts, further delaying adoption. In addition, compatibility issues between legacy equipment and advanced digital solutions can reduce the efficiency and scalability of smart infrastructure projects. Consequently, integration with legacy infrastructure remains a key challenge that can slow the deployment and growth of the smart infrastructure market.Key Players In The Global Smart infrastructure Market
Major companies operating in the smart infrastructure market are Apple Inc., Microsoft Corporation, Huawei Technologies Co. Ltd., Siemens AG, Hitachi Ltd., IBM Corporation, Cisco Systems Inc., Oracle Corporation, Schneider Electric SE, Broadcom Inc., Honeywell International Inc., ABB Ltd., Hewlett Packard Enterprise Company, Nokia Corporation, Xylem Inc., Itron Inc., Bentley Systems Incorporated, Larsen & Toubro Technology Services Limited, Aclara Technologies LLC, and Dynamic Ratings Inc.
This chart is for illustrative purposes; the full report includes a detailed competitor analysis and comprehensive overview of the top 10 companies in the market.
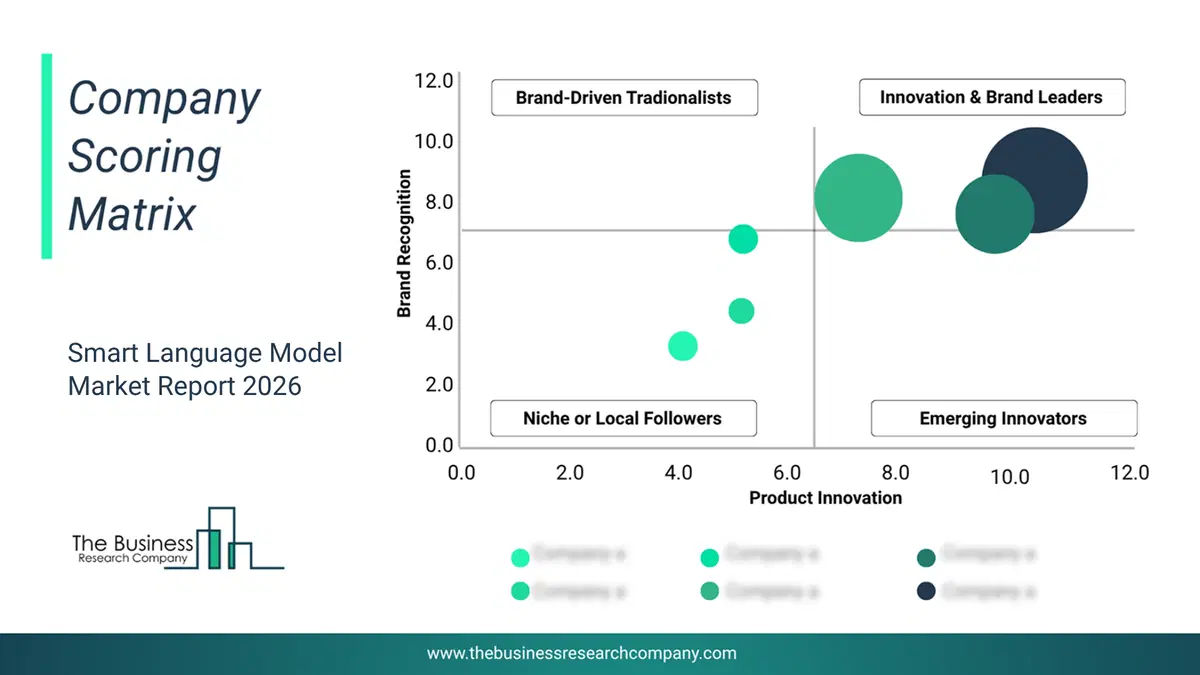
This chart maps companies by product innovation and brand strength, with bubble size indicating relative revenue, helping identify market leaders, challengers, and niche players. This is an illustrative chart; the full report provides a complete and accurate competitive analysis.
Global Smart infrastructure Market Trends and Insights
Major companies operating in the smart infrastructure market are focusing on innovative approaches, such as electrification of infrastructure to improve energy efficiency, reduce carbon emissions, enhance grid reliability, and enable the integration of renewable energy and digital technologies across urban and industrial systems. Electrification of infrastructure means replacing or supplementing systems that rely on fossil fuels or mechanical processes with electrically powered technologies, supported by intelligent, digitally managed power networks. For instance, in April 2024, Siemens AG, a Germany-based technology company, launched Electrification X, a digital platform designed to support the transformation of electrification infrastructure across commercial, industrial, and utility applications. The solution improves energy efficiency, operational performance, and sustainability while reducing costs and CO₂ emissions through scalable cloud services and interoperable software modules. The platform includes applications for load management, network fault detection, asset performance monitoring, and energy sustainability, integrating distributed grid and building systems into a unified digital ecosystem to support intelligent, future-ready infrastructure operations.What Are Latest Mergers And Acquisitions In The Smart infrastructure Market?
In January 2026, Netmore Group AB, a Sweden-based technology and connectivity company, acquired Actility for an undisclosed amount. With this acquisition, Netmore aims to accelerate its global expansion in Low-Power Wide-Area Network infrastructure and strengthen its IoT connectivity ecosystem by integrating Actility’s extensive mediation capabilities and deployments into its carrier-grade network services. Actility is a France-based technology company that offers smart infrastructure solutions.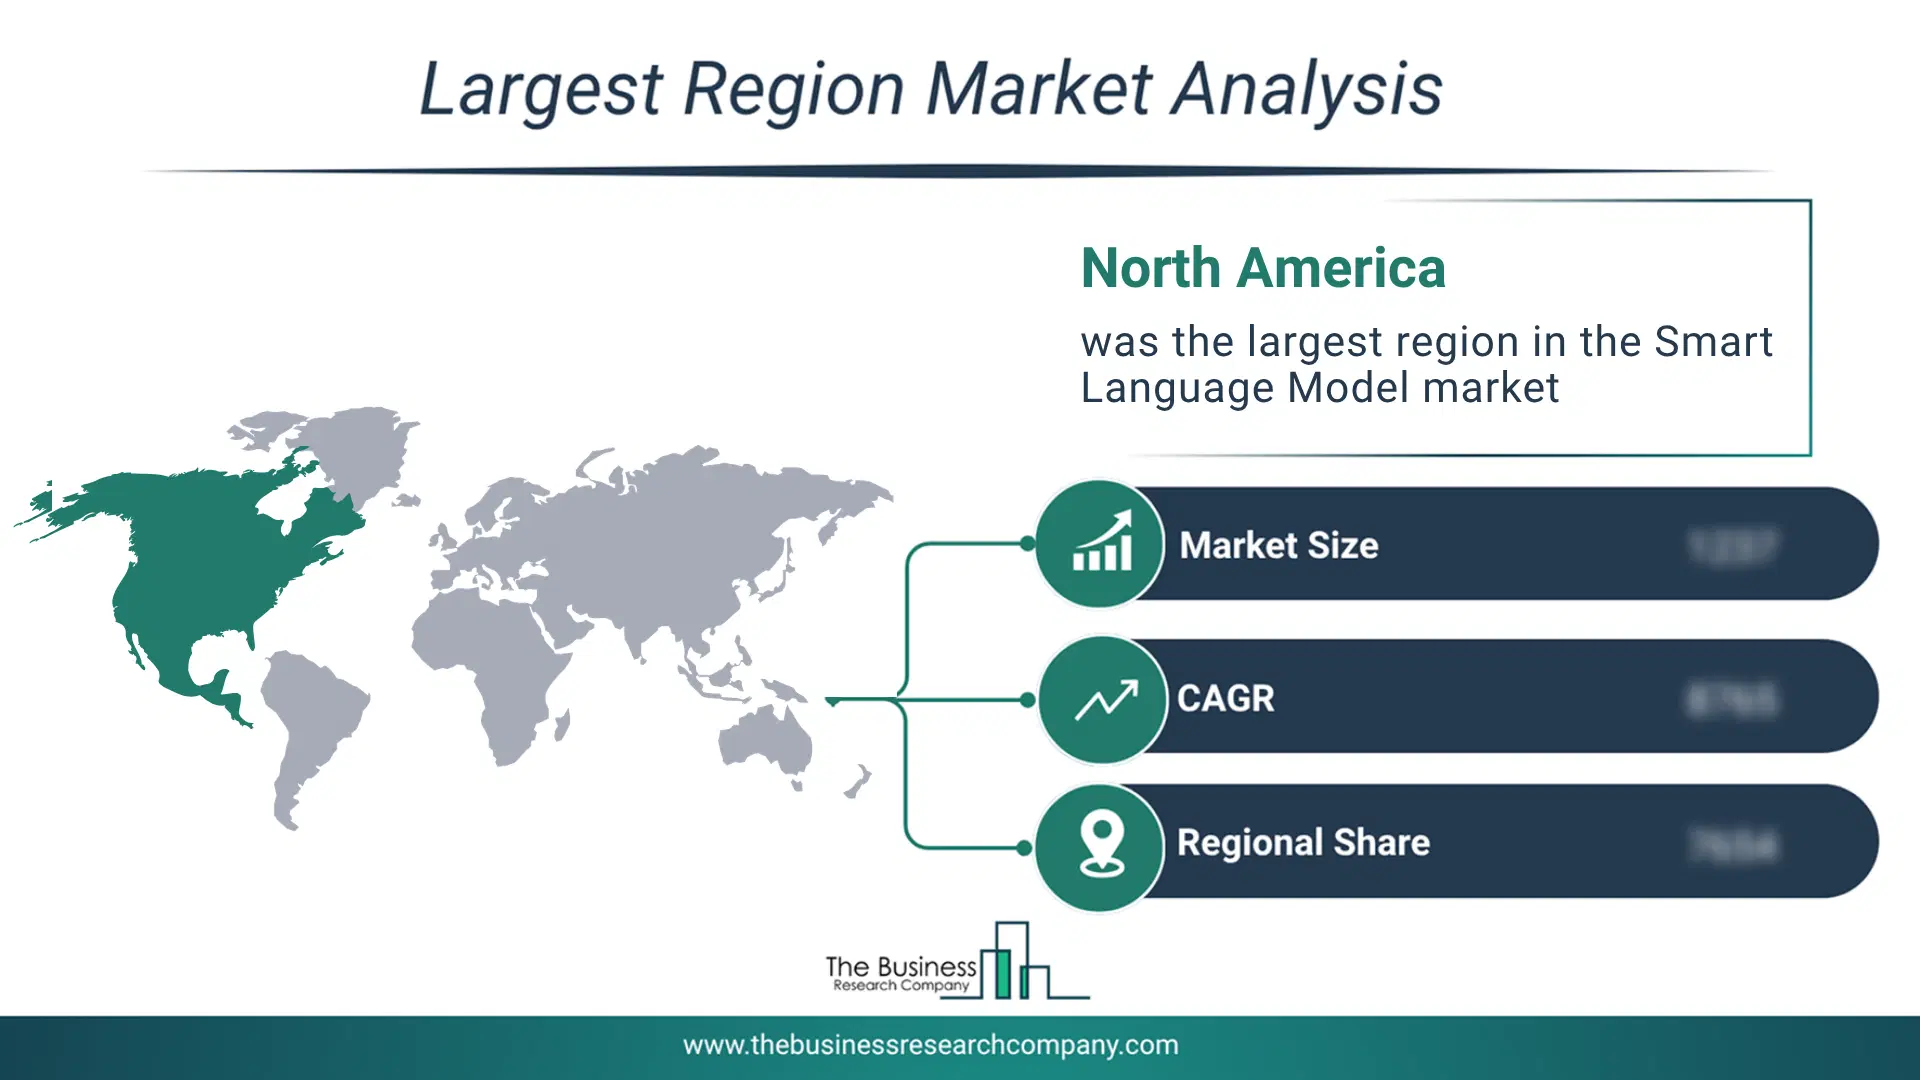
Regional Insights
North America was the largest region in the smart infrastructure market in 2025. Asia-Pacific is expected to be the fastest-growing region in the forecast period. The regions covered in this market report are Asia-Pacific, South East Asia, Western Europe, Eastern Europe, North America, South America, Middle East, Africa. The countries covered in this market report are Australia, Brazil, China, France, Germany, India, Indonesia, Japan, Taiwan, Russia, South Korea, UK, USA, Canada, Italy, Spain.What Defines the Smart infrastructure Market?
The smart infrastructure market consists of revenues earned by entities by providing services such as smart system integration, infrastructure monitoring and remote management, and predictive maintenance. The market value includes the value of related goods sold by the service provider or included within the service offering. The smart infrastructure market also consists of sales of IoT sensors and connected devices, smart meters, intelligent traffic management systems, building automation systems, and surveillance and monitoring equipment. Values in this market are ‘factory gate’ values, that is, the value of goods sold by the manufacturers or creators of the goods, whether to other entities (including downstream manufacturers, wholesalers, distributors, and retailers) or directly to end customers. The value of goods in this market includes related services sold by the creators of the goods.How is Market Value Defined and Measured?
The market value is defined as the revenues that enterprises gain from the sale of goods and/or services within the specified market and geography through sales, grants, or donations in terms of the currency (in USD unless otherwise specified). The revenues for a specified geography are consumption values that are revenues generated by organizations in the specified geography within the market, irrespective of where they are produced. It does not include revenues from resales along the supply chain, either further along the supply chain or as part of other products.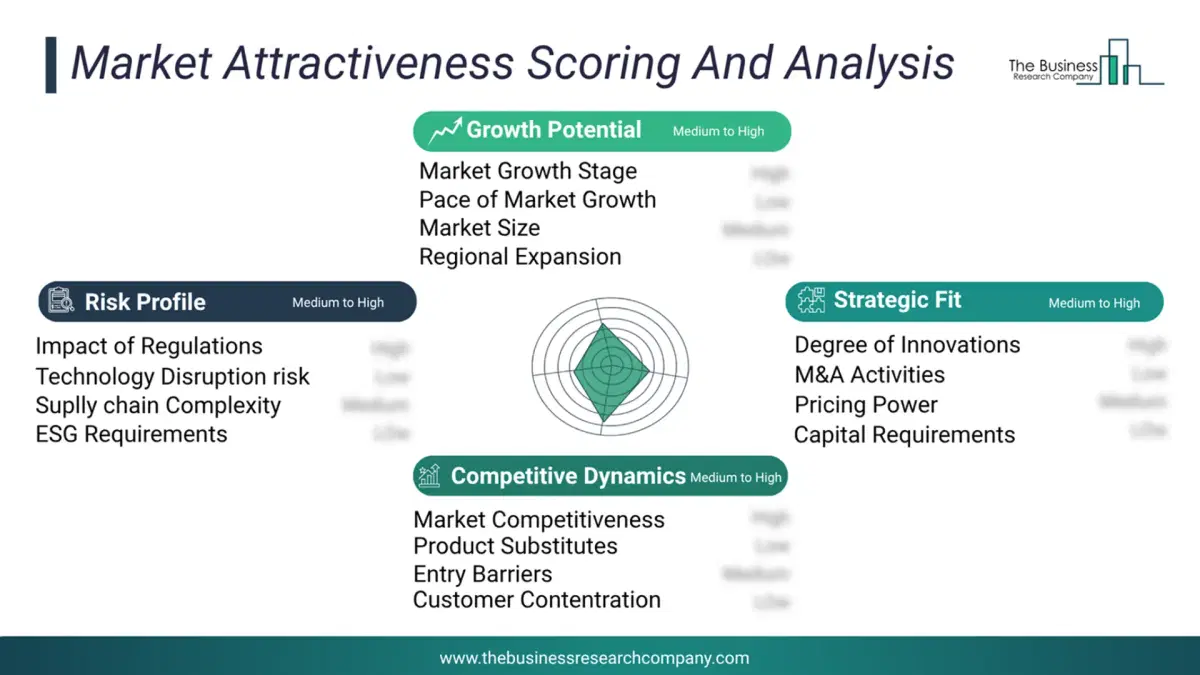
This chart presents market attractiveness based on a quantitative evaluation of growth, competition, strategic alignment, and risk, offering a clear view of opportunity areas for decision-making. This chart is for illustrative purposes; the full report contains the complete analysis.
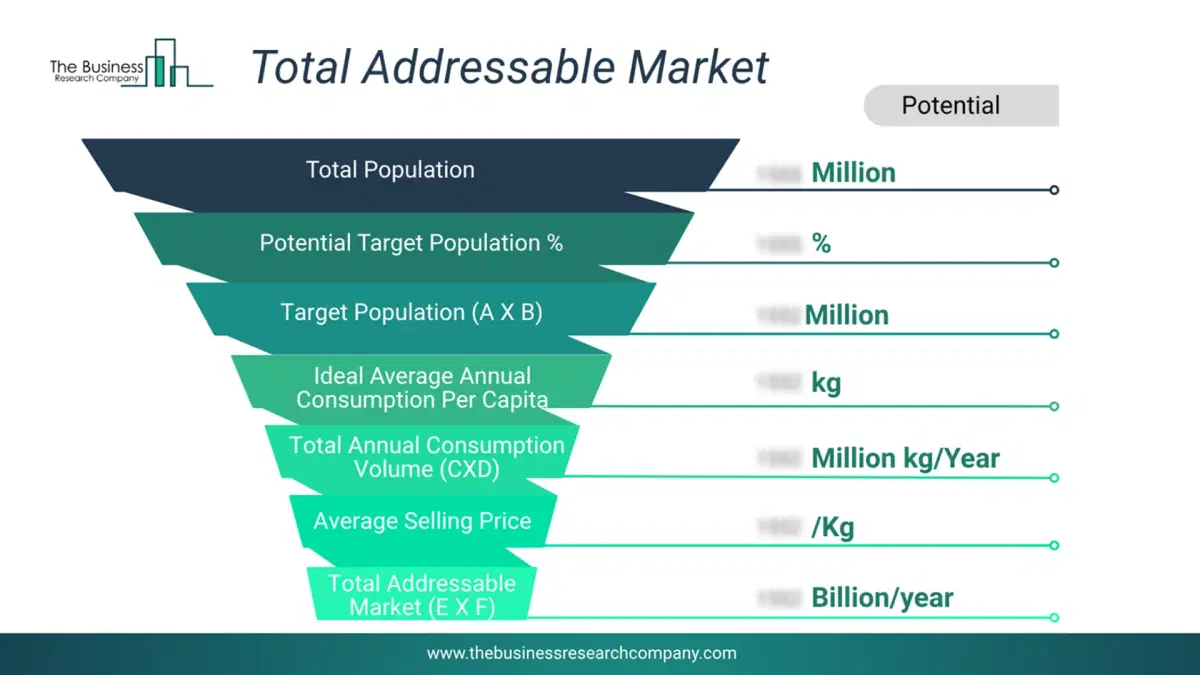
This chart highlights the Total Addressable Market (TAM) by estimating the maximum revenue opportunity using an assumption-driven approach, supporting strategic planning and opportunity sizing across markets. The chart is illustrative; the full report provides a more comprehensive analysis.
What Key Data and Analysis Are Included in the Smart infrastructure Market Report 2026?
The smart infrastructure market research report is one of a series of new reports from The Business Research Company that provides smart infrastructure market statistics, including smart infrastructure industry global market size, regional shares, competitors with a smart infrastructure market share, detailed smart infrastructure market segments, market trends and opportunities, and any further data you may need to thrive in the smart infrastructure industry. This smart infrastructure market research report delivers a complete perspective of everything you need, with an in-depth analysis of the current and future scenario of the industry.Smart infrastructure Market Report Forecast Analysis
| Report Attribute | Details |
|---|---|
| Market Size Value In 2026 | $590.01 billion |
| Revenue Forecast In 2030 | $1224.41 billion |
| Growth Rate | CAGR of 19.8% from 2026 to 2030 |
| Base Year For Estimation | 2025 |
| Actual Estimates/Historical Data | 2020-2025 |
| Forecast Period | 2026 - 2030 |
| Market Representation | Revenue in USD Billion and CAGR from 2026 to 2030 |
| Segments Covered | Component, Type, Technology, Application, End User |
| Regional Scope | Asia-Pacific, Western Europe, Eastern Europe, North America, South America, Middle East, Africa |
| Country Scope | The countries covered in the report are Australia, Brazil, China, France, Germany, India, ... |
| Key Companies Profiled | Apple Inc., Microsoft Corporation, Huawei Technologies Co. Ltd., Siemens AG, Hitachi Ltd., IBM Corporation, Cisco Systems Inc., Oracle Corporation, Schneider Electric SE, Broadcom Inc., Honeywell International Inc., ABB Ltd., Hewlett Packard Enterprise Company, Nokia Corporation, Xylem Inc., Itron Inc., Bentley Systems Incorporated, Larsen & Toubro Technology Services Limited, Aclara Technologies LLC, and Dynamic Ratings Inc. |
| Customization Scope | Request for Customization |
| Pricing And Purchase Options | Explore Purchase Options |