
Smart Water Grid Market Report 2026
Global Outlook – By Component (Hardware, Software, Services), By Deployment Model And Ownership (Utility-Operated Smart Water Grids, Private Or Commercial Smart Water Grids, Public-Private Partnership (PPP) Smart Water Grids, Community-Operated Smart Water Grids), By Technology Type (Advanced Metering Infrastructure (AMI), Supervisory Control And Data Acquisition (SCADA), Geographic Information System (GIS), Internet of Things (IoT)-Enabled Sensors And Devices, Data Analytics And Artificial Intelligence (AI) Platforms), By Application (Water Distribution, Leak Detection, Water Quality Monitoring, Energy Management) – Market Size, Trends, Strategies, and Forecast to 2030
Smart Water Grid Market Overview
• Smart Water Grid market size has reached to $21.95 billion in 2025 • Expected to grow to $40.46 billion in 2030 at a compound annual growth rate (CAGR) of 13.1% • Growth Driver: Increasing Urban Water Scarcity Fueling The Growth Of The Market Due To The Need For Real-Time Monitoring, Leakage Reduction, And Efficient Water Resource Management • Market Trend: Advancements In Sensor Network Intelligence And Next-Generation Smart Metering Technologies • North America was the largest region in 2025 and Asia-Pacific is the fastest growing region.Market Gains By 2030 – Top Opportunities By Segment
Market Gain identifies the most promising market opportunities by highlighting the segments or products expected to generate the highest incremental revenue growth over the next five years.
What Is Covered Under Smart Water Grid Market?
A smart water grid is a digitally enabled water management system that uses sensors, communication networks, and analytics to monitor and control water distribution in real time. It helps to improve water efficiency, reduce losses, and ensure a reliable supply through early detection of leaks, pressure issues, and quality problems. It enables optimized operations, better resource conservation, and data-driven decision-making for utilities and municipalities. The main components of smart water grids include hardware, software, and services. Hardware refers to physical devices and equipment that enable monitoring, control, and automation of water distribution and management systems. These grids can be deployed through utility-operated smart water grids, private or commercial smart water grids, public-private partnership (PPP) smart water grids, or community-operated smart water grids, and incorporate technology types such as advanced metering infrastructure (AMI), supervisory control and data acquisition (SCADA), geographic information system (GIS), internet of things (IoT)-enabled sensors and devices, and data analytics and artificial intelligence (AI) platforms. The various applications involved are water distribution, leak detection, water quality monitoring, and energy management. The end users of smart water grids include municipalities or government, agriculture, commercial enterprises, residential users, public or private utilities, and industrial users.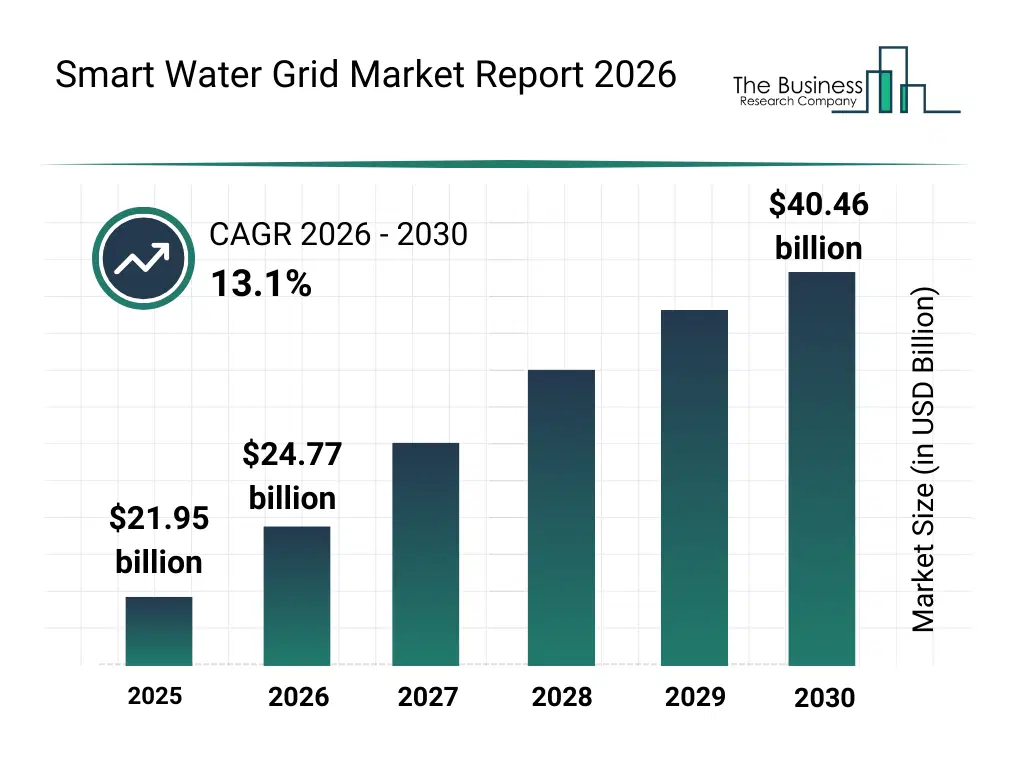
What Is The Smart Water Grid Market Size and Share 2026?
The smart water grid market size has grown rapidly in recent years. It will grow from $21.95 billion in 2025 to $24.77 billion in 2026 at a compound annual growth rate (CAGR) of 12.8%. The growth in the historic period can be attributed to aging water distribution infrastructure, rising urban population growth, increasing water scarcity concerns, government investments in utility modernization, growing demand for efficient resource management.What Is The Smart Water Grid Market Growth Forecast?
The smart water grid market size is expected to see rapid growth in the next few years. It will grow to $40.46 billion in 2030 at a compound annual growth rate (CAGR) of 13.1%. The growth in the forecast period can be attributed to accelerating smart city infrastructure projects, rising adoption of ai based utility analytics, increasing regulatory focus on water conservation, expansion of digital utility management platforms, growth in industrial water monitoring needs. Major trends in the forecast period include increasing deployment of smart water metering infrastructure, rising adoption of real time leak detection and pressure monitoring systems, growing integration of ai driven water demand forecasting platforms, expansion of cloud based water data management solutions, development of advanced sensor based water quality monitoring networks.
Global Smart Water Grid Market Segmentation
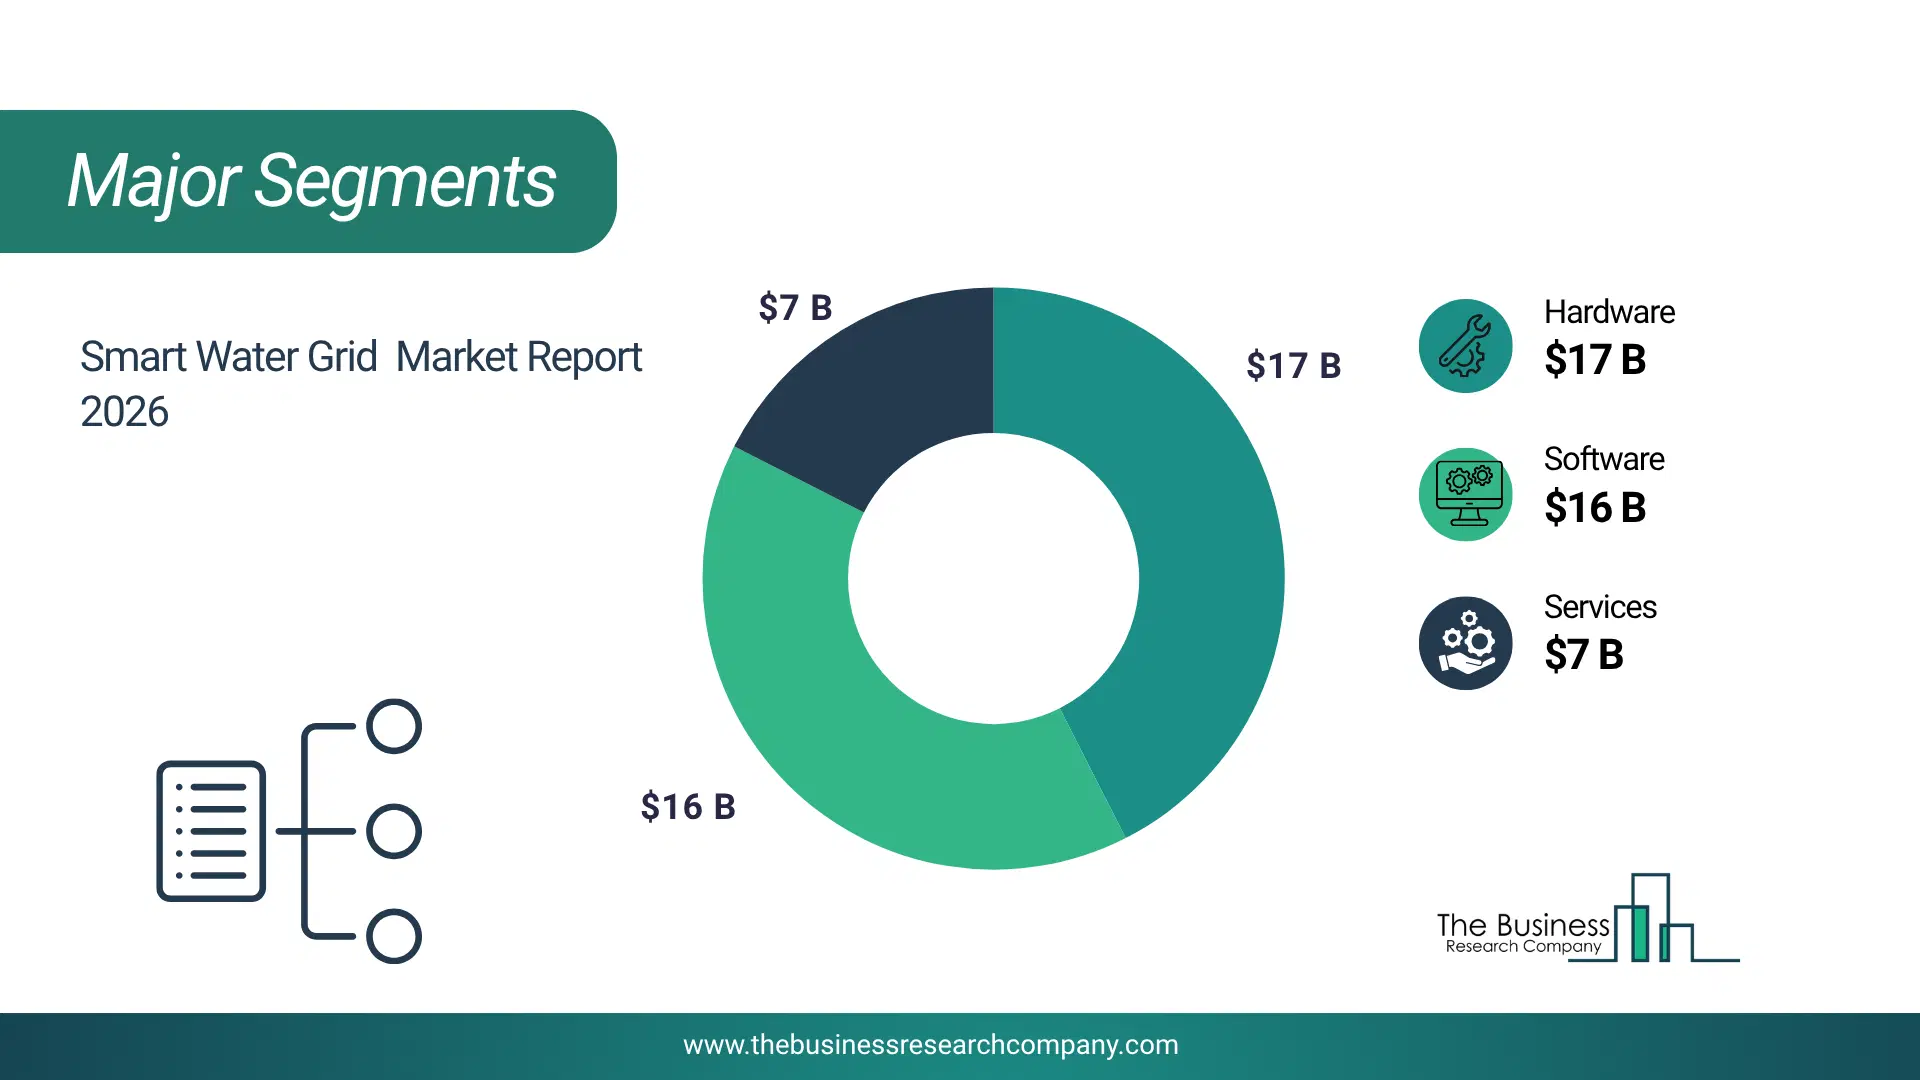
1) By Component: Hardware, Software, Services 2) By Deployment Model And Ownership: Utility-Operated Smart Water Grids, Private Or Commercial Smart Water Grids, Public-Private Partnership (PPP) Smart Water Grids, Community-Operated Smart Water Grids 3) By Technology Type: Advanced Metering Infrastructure (AMI), Supervisory Control And Data Acquisition (SCADA), Geographic Information System (GIS), Internet of Things (IoT)-Enabled Sensors And Devices, Data Analytics And Artificial Intelligence (AI) Platforms 4) By Application: Water Distribution, Leak Detection, Water Quality Monitoring, Energy Management 5) By End-User: Municipalities Or Government, Agriculture, Commercial Enterprises, Residential Users, Public Or Private Utilities, Industrial Users Subsegments: 1) By Hardware: Smart Meters, Sensors, Communication Devices 2) By Software: Meter Data Management Software, Grid Management Software, Analytics And Reporting Software 3) By Services: Installation Services, Maintenance Services, Consulting Services The top segments in the smart water grid market will be: • Hardware will reach $16.75 Billion by 2030. • Software will reach $16.25 Billion by 2030. • Services will reach $7.47 Billion by 2030.What Is The Driver Of The Smart Water Grid Market?
The increasing urban water scarcity is expected to propel the growth of the smart water grid market going forward. Urban water scarcity refers to a situation in which a city or urban area does not have enough freshwater supply to meet the needs of its population, industries, and services, either in quantity, quality, or both. Urban water scarcity is increasing due to rapid urban population growth that intensifies water consumption while stressing existing supply systems. The smart water grid supports urban water scarcity management by enabling real-time monitoring, leakage reduction, demand optimization, and efficient allocation of limited water resources across urban networks. For instance, in November 2024, the Dubai Electricity and Water Authority (DEWA), a UAE-based government organization, reported that its total desalinated water production increased by 4.64% year-on-year in the third quarter of 2024, reaching a record 40.5 billion imperial gallons. This increase reflects DEWA’s efforts to meet rising water demand and support Dubai’s rapid urban growth. During the same period, peak desalinated water demand reached 455 million imperial gallons per day (MIGD), representing a 4.92% increase compared to the third quarter of 2023. Therefore, the increasing urban water scarcity is driving the growth of the smart water grid industry.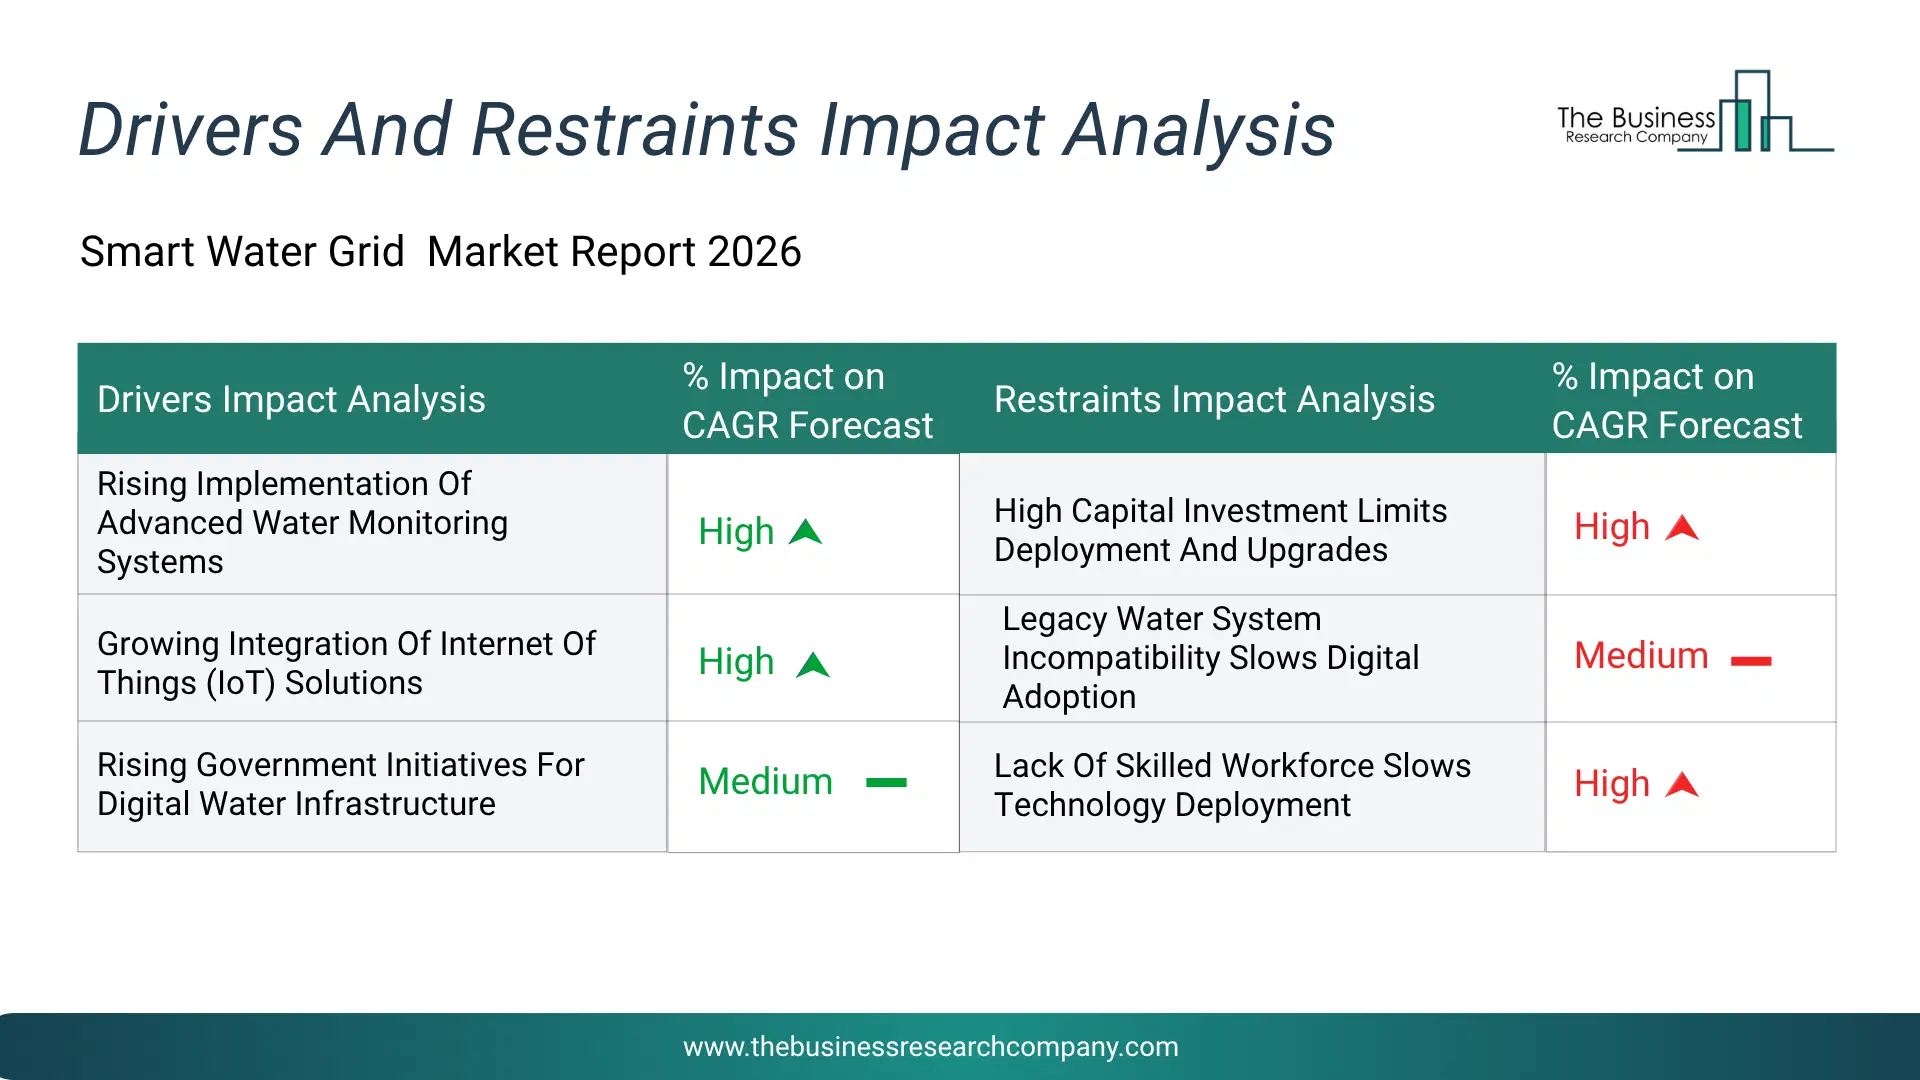
Infographic Chart Showing Key Market Drivers Analysis And Restraints For Smart Water Grid Market
The chart presents an impact analysis of key drivers and restraints, quantifying their relative influence on the market's growth rate and helping assess the balance between growth enablers and limiting factors. This chart offers a high-level perspective; the full report contains more detailed insights.
How Will The Drivers Impact Growth In The Global Smart Water Grid Market?
• Rising Implementation Of Advanced Water Monitoring Systems (High) – During the forecast period, the rising implementation of advanced water monitoring systems is expected to become a key growth driver for the smart water grid market by 2030. Utilities are increasingly deploying real-time monitoring technologies to track flow rates, pressure levels, and system performance across complex distribution networks. These systems enable early detection of inefficiencies, support proactive maintenance, and enhance overall operational reliability. The ability to continuously monitor water infrastructure also improves decision-making through data-driven insights. As utilities transition toward more responsive and resilient systems, adoption of advanced monitoring technologies is accelerating globally. • Growing Integration Of Internet Of Things (IoT) Solutions (High) – During the forecast period, the growing integration of Internet of Things (IoT) solutions is expected to emerge as a major factor driving the expansion of the smart water grid market by 2030. IoT-enabled devices facilitate seamless connectivity between physical water assets and digital platforms, enabling continuous data collection and system automation. These technologies support remote operations, improve network visibility, and enhance asset performance through predictive analytics. The increasing deployment of connected devices across water networks is transforming traditional infrastructure into intelligent ecosystems. • Rising Government Initiatives For Digital Water Infrastructure (Medium) – During the forecast period, the rising government initiatives for digital water infrastructure are expected to act as a key growth catalyst for the smart water grid market by 2030. Public sector investments are accelerating the modernization of water systems through funding programs, policy frameworks, and large-scale digital transformation projects. Governments are prioritizing efficient water management to address urbanization pressures, climate variability, and long-term sustainability goals. These initiatives are fostering widespread adoption of smart technologies across municipal and regional water networks.How Will The Restraints Impact Growth In The Global Smart Water Grid Market?
• High Capital Investment Limits Deployment And Upgrades (High) – During the forecast period, high capital investment limits deployment and upgrades is restricting the growth of the smart water grid market. Significant upfront costs for sensors, communication networks, and digital infrastructure are creating financial barriers for utilities, thereby limiting large-scale implementation • Legacy Water System Incompatibility Slows Digital Adoption (High) – During the forecast period, legacy water system incompatibility slows digital adoption is restricting the growth of the smart water grid market. Challenges in integrating modern smart technologies with existing aging water infrastructure are creating operational inefficiencies and delaying transformation initiatives • Lack Of Skilled Workforce Slows Technology Deployment (Medium) – During the forecast period, lack of skilled workforce slows technology deployment is restricting the growth of the smart water grid market. Limited availability of professionals with expertise in digital water management, IoT systems, and data analytics is hindering effective deployment and operationKey Players In The Global Smart Water Grid Market
Major companies operating in the smart water grid market are Siemens AG, IBM Corporation, Oracle Corporation, Schneider Electric SE, Honeywell International Inc., Trimble Inc., Itron Inc., Mueller Water Products Inc., Badger Meter Inc., Arqiva Group Limited, Kamstrup A/S, Arad Group, Fluentgrid Limited, CIMCON Software India Pvt Ltd, Diehl Stiftung & Co. KG, Aquarius Spectrum Ltd., Omnitell Tech, Micronova Impex Pvt. Ltd., Ketos Water Solutions, BridgeThings IoT Pvt. Ltd., Ayyeka Technologies Ltd., Valarm LLC, ICT Co. Ltd., Xinapse Systems Ltd, and Kariot Solutions Pvt. Ltd.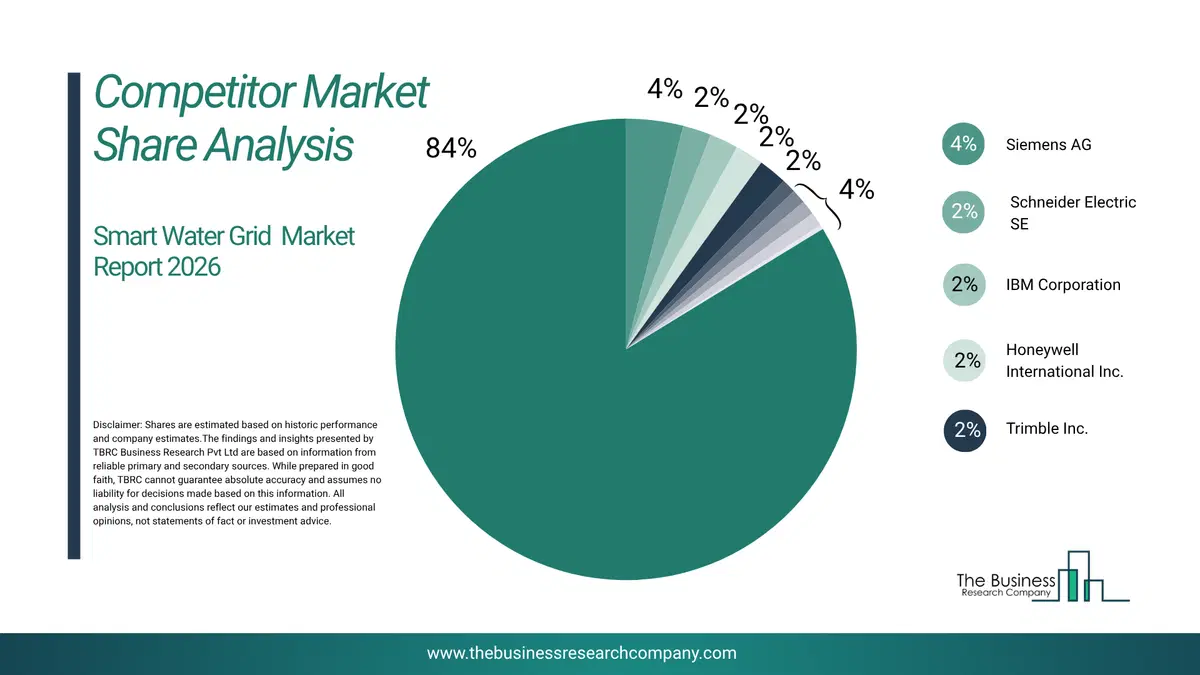
This chart is for illustrative purposes; the full report includes a detailed competitor analysis and comprehensive overview of the top 10 companies in the market.
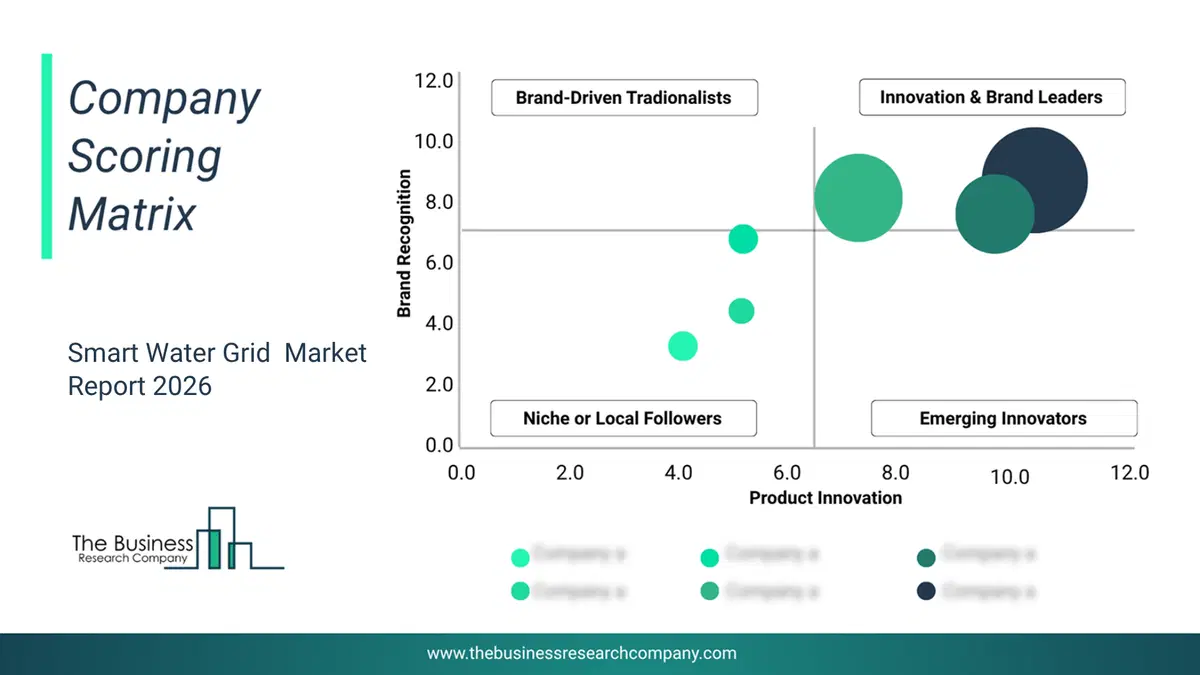
This chart maps companies by product innovation and brand strength, with bubble size indicating relative revenue, helping identify market leaders, challengers, and niche players. This is an illustrative chart; the full report provides a complete and accurate competitive analysis.
Global Smart Water Grid Market Trends and Insights
Major companies operating in the smart water grid market are focusing on technological enhancements in sensor networks to improve real-time water monitoring efficiency, such as advanced smart metering infrastructure (AMI 2.0), to gain higher data accuracy, network reliability, and actionable operational insights across distribution systems. Advanced smart metering infrastructure (AMI 2.0) refers to the next evolution of smart metering systems that combine intelligent sensing, high-frequency data capture, and two-way digital communication. For instance, in September 2024, Metron, a France-based cleantech company, launched the Ultrasonic Smart Water Meter. This innovative meter provides highly accurate, non-intrusive measurement of water flow by utilizing sound waves, eliminating mechanical components, and minimizing wear and maintenance needs. Its solid-state design ensures reliable performance even in challenging conditions, such as low-flow scenarios and water with sediment. Additionally, the meter facilitates high-frequency, real-time data logging, which supports early leak detection and consumption analytics.What Are Latest Mergers And Acquisitions In The Smart Water Grid Market?
In December 2025, ACEA SpA, an Italy-based provider of integrated water, energy, and environmental services, acquired Aquanexa for an undisclosed amount. With this acquisition, ACEA aims to strengthen its leadership and technological capabilities in smart water cycle management by integrating Aquanexa’s digital solutions, advanced sensing, and operational services into its water infrastructure offerings. Aquanexa is an Italy-based company specializing in integrated and digitally enabled water cycle management solutions.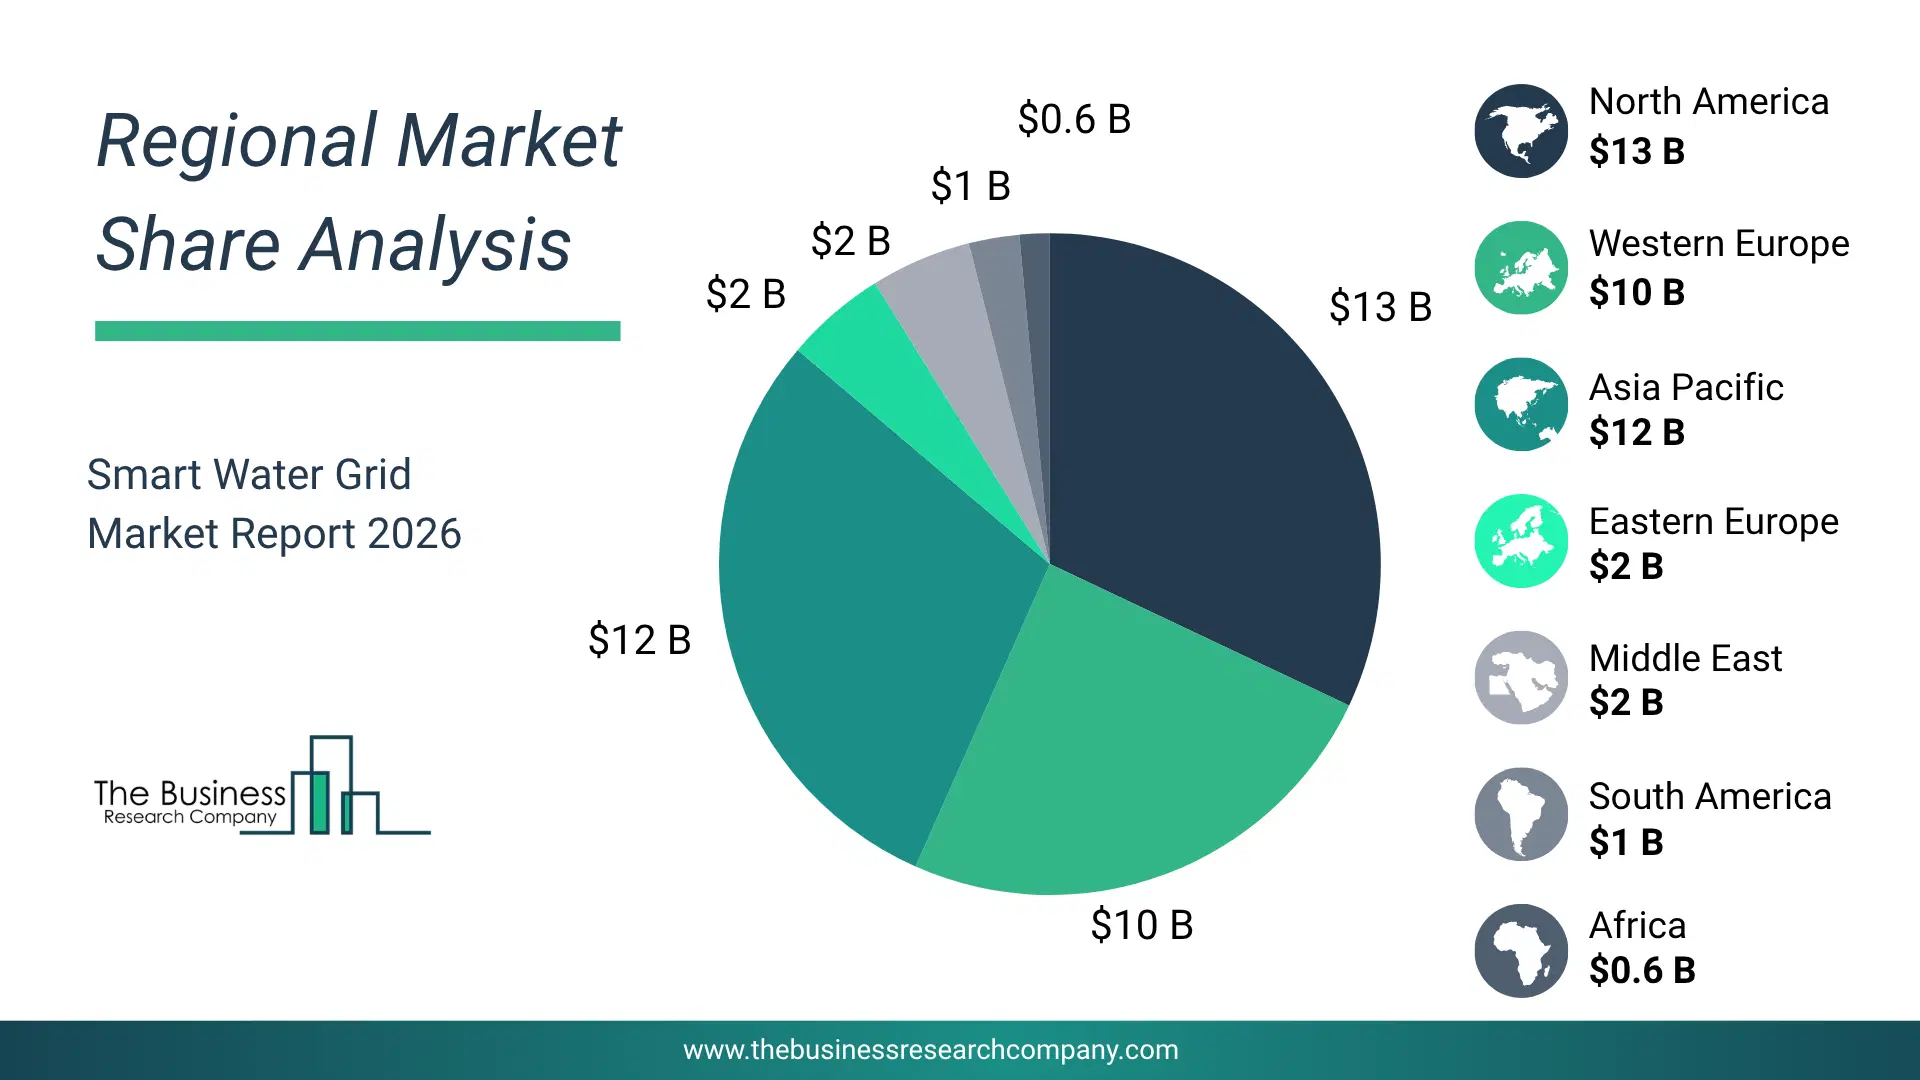
Regional Outlook
North America was the largest region in the smart water grid market in 2025. Asia-Pacific is expected to be the fastest-growing region in the forecast period. The regions covered in this market report are Asia-Pacific, South East Asia, Western Europe, Eastern Europe, North America, South America, Middle East, Africa. The countries covered in this market report are Australia, Brazil, China, France, Germany, India, Indonesia, Japan, Taiwan, Russia, South Korea, UK, USA, Canada, Italy, Spain.What Defines the Smart Water Grid Market?
The smart water grid market consists of revenues earned by entities by providing services such as water network monitoring, demand forecasting and analytics, remote meter reading services, asset management services, pressure management services, predictive maintenance services, data integration and management services, and system integration services. The market value includes the value of related goods sold by the service provider or included within the service offering. The smart water grid market includes sales of smart water meters, pressure sensors, flow meters, water quality sensors, remote terminal units, communication gateways, control valves, data loggers, supervisory control and data acquisition hardware, and edge computing devices. Values in this market are ‘factory gate’ values, that is, the value of goods sold by the manufacturers or creators of the goods, whether to other entities (including downstream manufacturers, wholesalers, distributors, and retailers) or directly to end customers. The value of goods in this market includes related services sold by the creators of the goods.How is Market Value Defined and Measured?
The market value is defined as the revenues that enterprises gain from the sale of goods and/or services within the specified market and geography through sales, grants, or donations in terms of the currency (in USD unless otherwise specified). The revenues for a specified geography are consumption values that are revenues generated by organizations in the specified geography within the market, irrespective of where they are produced. It does not include revenues from resales along the supply chain, either further along the supply chain or as part of other products.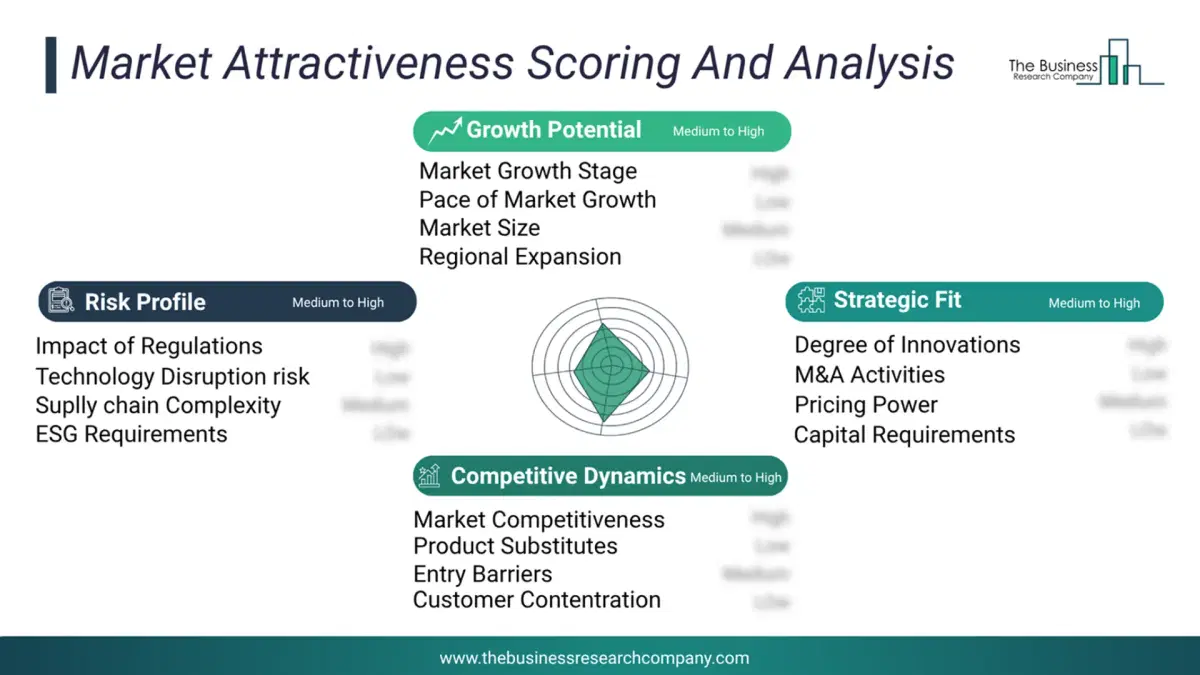
This chart presents market attractiveness based on a quantitative evaluation of growth, competition, strategic alignment, and risk, offering a clear view of opportunity areas for decision-making. This chart is for illustrative purposes; the full report contains the complete analysis.
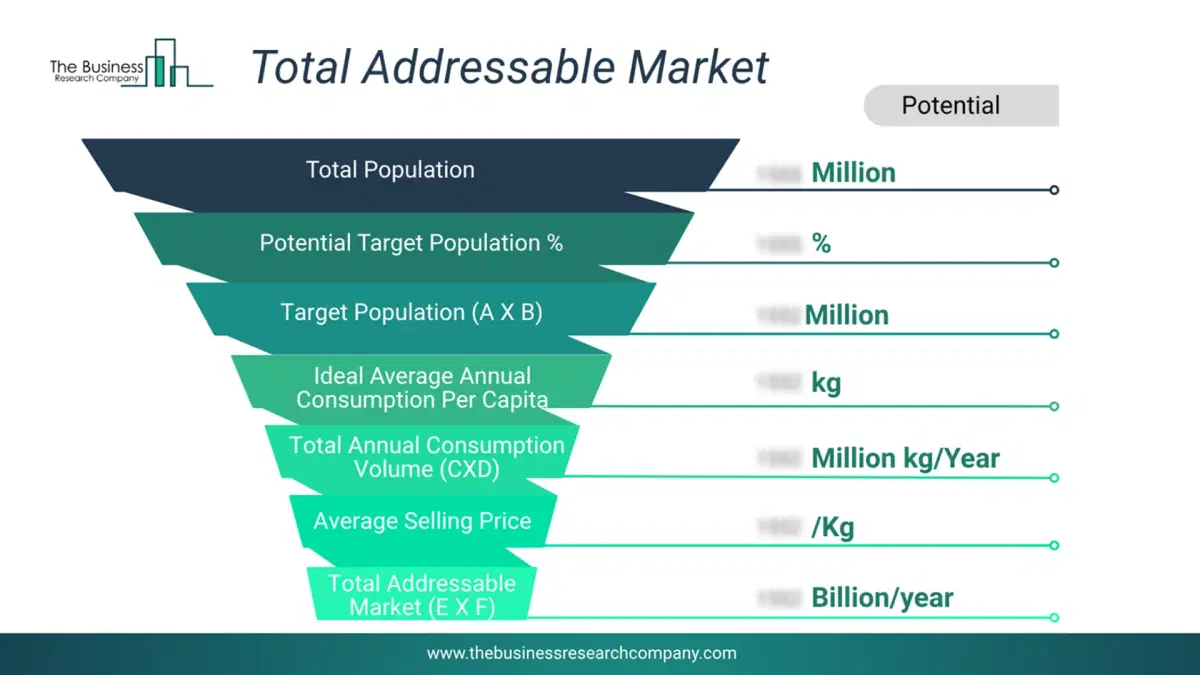
This chart highlights the Total Addressable Market (TAM) by estimating the maximum revenue opportunity using an assumption-driven approach, supporting strategic planning and opportunity sizing across markets. The chart is illustrative; the full report provides a more comprehensive analysis.
What Key Data and Analysis Are Included in the Smart Water Grid Market Report 2026?
The smart water grid market research report is one of a series of new reports from The Business Research Company that provides market statistics, including industry global market size, regional shares, competitors with the market share, detailed market segments, market trends and opportunities, and any further data you may need to thrive in the smart water grid industry. The market research report delivers a complete perspective of everything you need, with an in-depth analysis of the current and future state of the industry.Smart Water Grid Market Report Forecast Analysis
| Report Attribute | Details |
|---|---|
| Market Size Value In 2026 | $24.77 billion |
| Revenue Forecast In 2030 | $40.46 billion |
| Growth Rate | CAGR of 12.8% from 2026 to 2030 |
| Base Year For Estimation | 2025 |
| Actual Estimates/Historical Data | 2020-2025 |
| Forecast Period | 2026 - 2030 |
| Market Representation | Revenue in USD Billion and CAGR from 2026 to 2030 |
| Segments Covered | Component, Deployment Model And Ownership, Technology Type, Application, End-User |
| Regional Scope | Asia-Pacific, Western Europe, Eastern Europe, North America, South America, Middle East, Africa |
| Country Scope | The countries covered in the report are Australia, Brazil, China, France, Germany, India, Indonesia, Japan, Taiwan, Russia, South Korea, UK, USA, Canada, Italy, Spain. |
| Key Companies Profiled | Siemens AG, IBM Corporation, Oracle Corporation, Schneider Electric SE, Honeywell International Inc., Trimble Inc., Itron Inc., Mueller Water Products Inc., Badger Meter Inc., Arqiva Group Limited, Kamstrup A/S, Arad Group, Fluentgrid Limited, CIMCON Software India Pvt Ltd, Diehl Stiftung & Co. KG, Aquarius Spectrum Ltd., Omnitell Tech, Micronova Impex Pvt. Ltd., Ketos Water Solutions, BridgeThings IoT Pvt. Ltd., Ayyeka Technologies Ltd., Valarm LLC, ICT Co. Ltd., Xinapse Systems Ltd, and Kariot Solutions Pvt. Ltd. |
| Customization Scope | Request for Customization |
| Pricing And Purchase Options | Explore Purchase Options |