
Synthetic-Data Visualization Display Market Report 2026
Global Outlook – By Component (Software, Hardware, Services), By Deployment Mode (On-Premises, Cloud), By Application (Healthcare, Finance, Retail, Automotive, Information Technology And Telecommunications, Education, Other Application Types), By End-User (Enterprises, Research Institutes, Government, Other End-User Types) – Market Size, Trends, Strategies, and Forecast to 2030
Synthetic-Data Visualization Display Market Overview
• Synthetic-Data Visualization Display market size has reached to $1.27 billion in 2025 • Expected to grow to $3.54 billion in 2030 at a compound annual growth rate (CAGR) of 22.7% • Growth Driver: Digitalization Of Enterprises Driving Growth In The Market Due To Increasing Operational Efficiency And Data-Driven Decision-Making • Market Trend: Leading Companies Driving Innovation With Agentic AI For Enhanced Data Insights • North America was the largest region in 2025.What Is Covered Under Synthetic-Data Visualization Display Market?
Synthetic-data visualization display refers to a platform that presents artificially generated data through visual formats such as charts, graphs, and dashboards. It enables users to analyze, interpret, and derive insights from synthetic datasets for AI model training, simulations, or testing scenarios. The main component types of synthetic-data visualization display are software, hardware, and services. Software refers to a set of programs and instructions that enable a computer or device to perform specific tasks. These are deployed through on-premises and cloud. These are finding applications across sectors such as healthcare, finance, retail, automotive, information technology and telecommunications, education, and others, serving end-users including enterprises, research institutes, government, and others.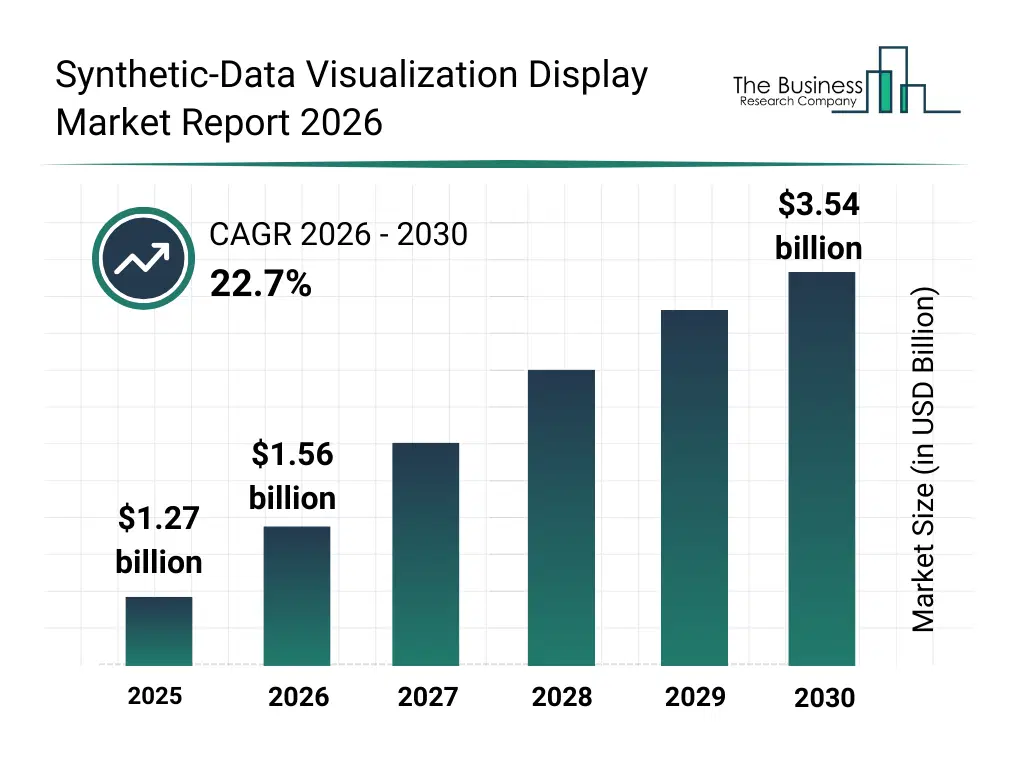
What Is The Synthetic-Data Visualization Display Market Size and Share 2026?
The synthetic-data visualization display market size has grown exponentially in recent years. It will grow from $1.27 billion in 2025 to $1.56 billion in 2026 at a compound annual growth rate (CAGR) of 23.0%. The growth in the historic period can be attributed to growth in AI model training, adoption of cloud analytics platforms, increasing use of synthetic data for simulations, rise of enterprise data visualization needs, development of specialized visualization hardware.What Is The Synthetic-Data Visualization Display Market Growth Forecast?
The synthetic-data visualization display market size is expected to see exponential growth in the next few years. It will grow to $3.54 billion in 2030 at a compound annual growth rate (CAGR) of 22.7%. The growth in the forecast period can be attributed to expansion of real-time synthetic-data analytics, integration with immersive ar/xr environments, adoption in healthcare and finance applications, development of edge-based visualization devices, increasing demand for interactive dashboards and simulation tools. Major trends in the forecast period include AI-driven data visualization, cloud-based synthetic data platforms, real-time data analytics, interactive dashboard development, simulation-based insights.
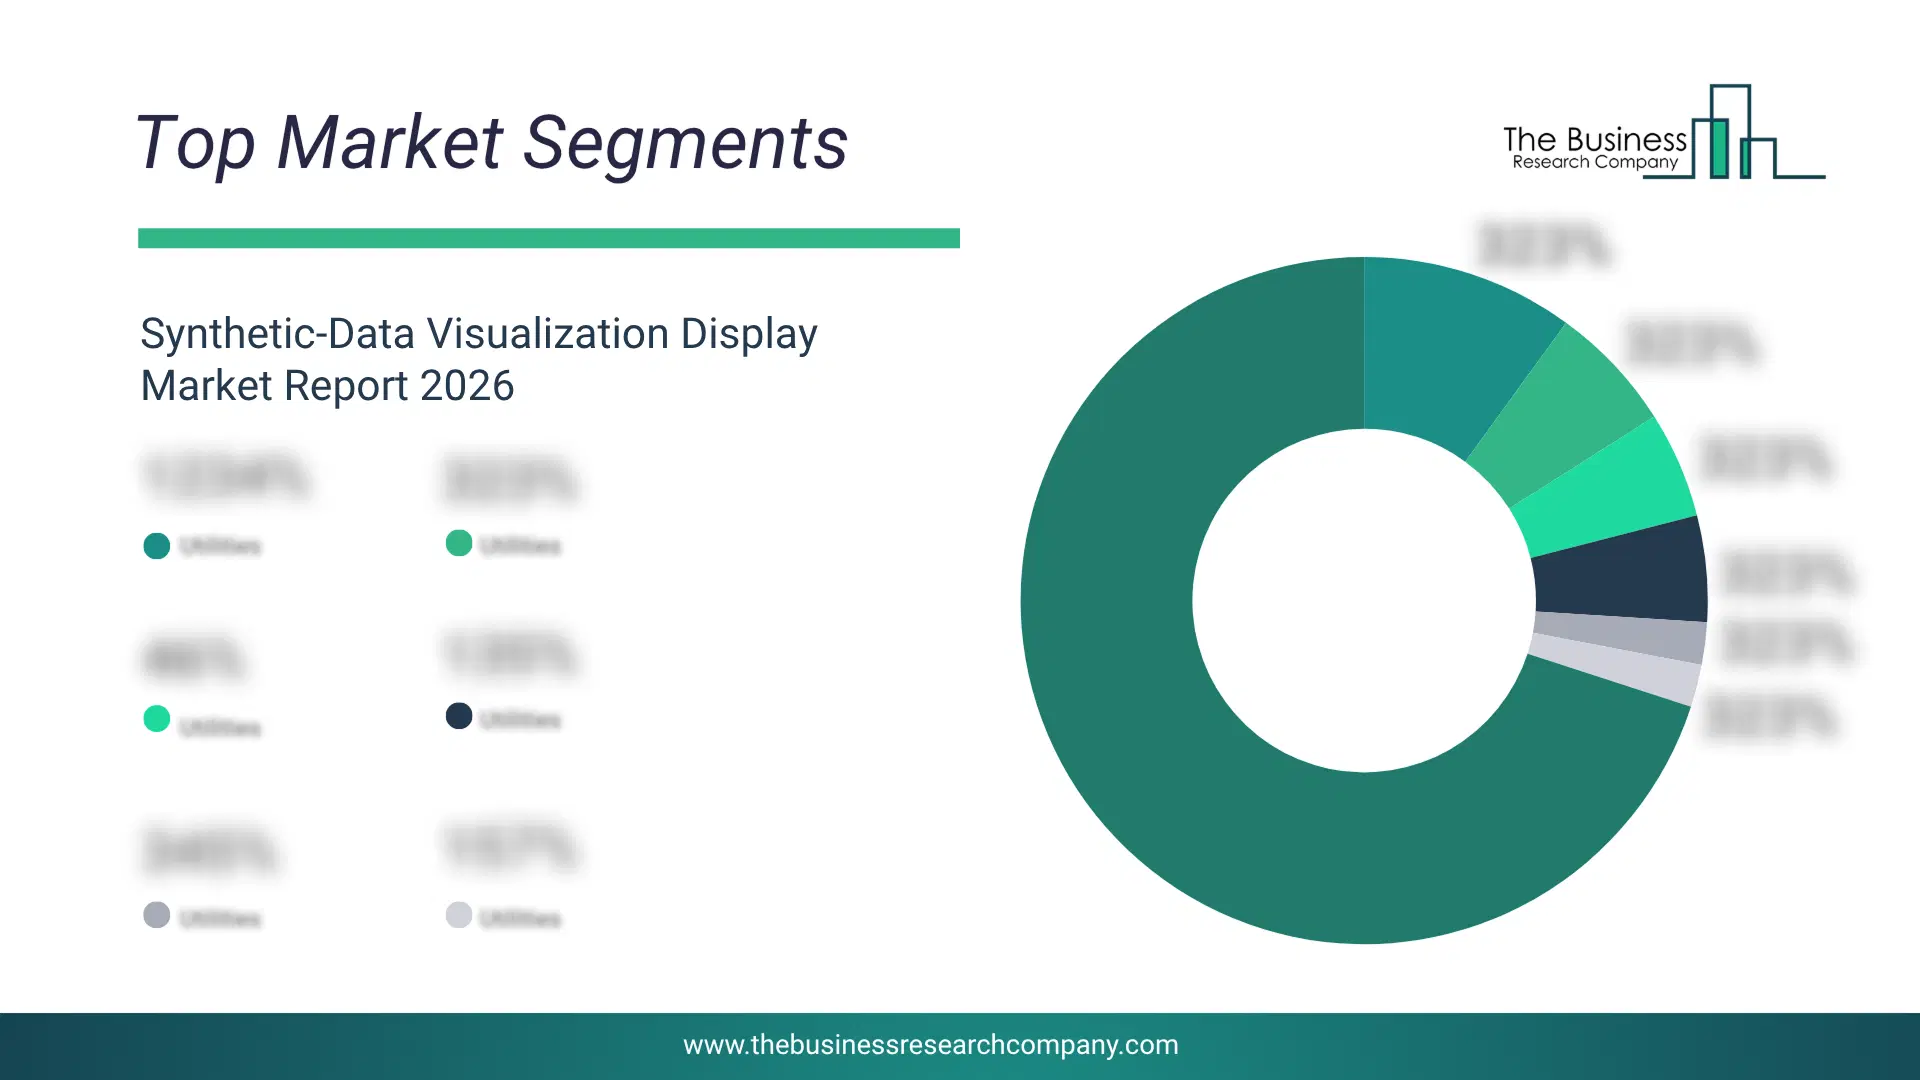
Global Synthetic-Data Visualization Display Market Segmentation
1) By Component: Software, Hardware, Services 2) By Deployment Mode: On-Premises, Cloud 3) By Application: Healthcare, Finance, Retail, Automotive, Information Technology And Telecommunications, Education, Other Application Types 4) By End-User: Enterprises, Research Institutes, Government, Other End-User Types Subsegments: 1) By Software: Data Analytics Software, Visualization Software, Simulation Software 2) By Hardware: Servers, Workstations, Edge Devices 3) By Services: Consulting, Implementation, Support And MaintenanceWhat Is The Driver Of The Synthetic-Data Visualization Display Market?
The surge in digitalization of enterprises is expected to propel the growth of the synthetic-data visualization display market going forward. Digitalization of enterprises involves incorporating digital technologies across all business operations to boost efficiency, productivity, and overall value creation. The adoption of digitalization is rising as organizations aim to achieve higher operational efficiency, with digital tools automating manual tasks, minimizing errors, and accelerating decision-making. Synthetic-data visualization display supports digitalization of enterprises by creating and visualizing artificial datasets, facilitating faster, data-driven decisions, enhancing predictive analytics, and optimizing operations without depending entirely on real-world data. For instance, in March 2024, according to a report published by the United States Census Bureau, a US-based federal statistical agency, the adoption of AI is increasing swiftly, climbing from 3.7% of companies in Fall 2023 to 5.4% in February 2024, with projections indicating a rise to 6.6% by Fall 2024, while the employment-weighted usage rate suggests that about 12% of workers in firms will be using AI by that time. Therefore, the surge in digitalization of enterprises is driving the growth of the synthetic-data visualization display industry.Key Players In The Global Synthetic-Data Visualization Display Market
Major companies operating in the synthetic-data visualization display market are Amazon Web Services Inc., Siemens AG, Nvidia Corp., Zoho Corporation, TIBCO Software Inc., ThoughtSpot Inc., Domo Inc., H2O.AI Inc., Tonic.ai, MOSTLY AI, Virtualitics Inc., Sky Engine, Infogram Inc., Sightwise, Bifrost AI Pte. Ltd., Looking Glass Factory Inc., Polymer Search Inc., Rendered.ai, Scale Synthetic, Syntheticus.AI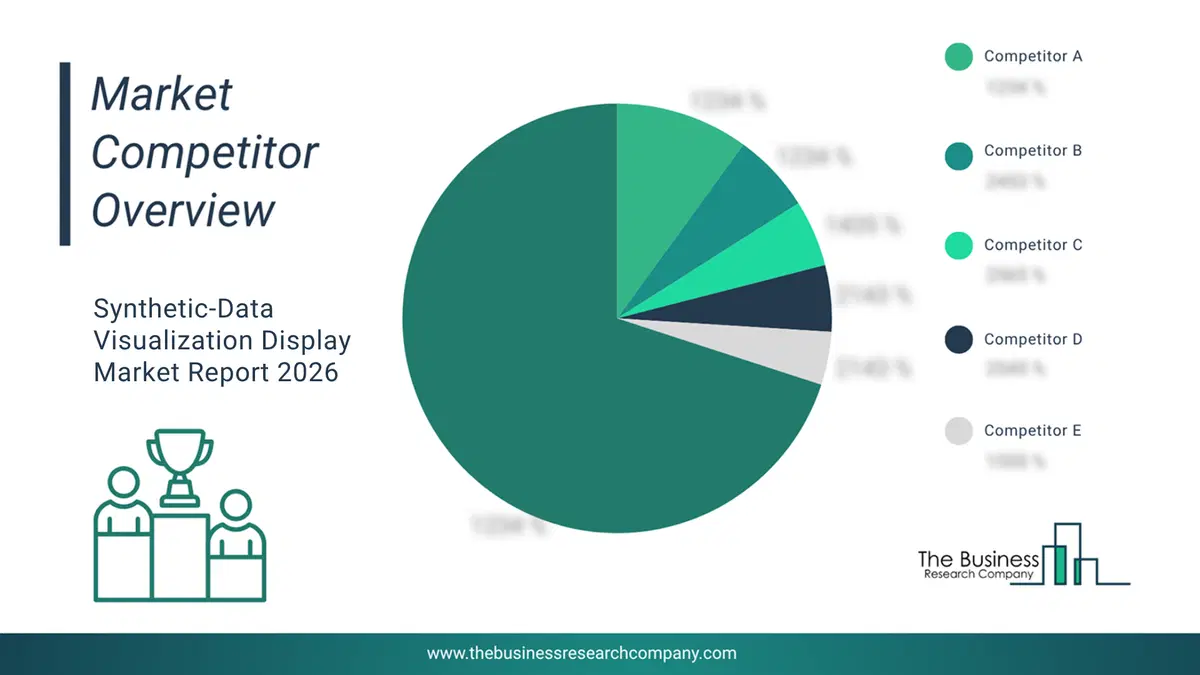
This chart is for illustrative purposes; the full report includes a detailed competitor analysis and comprehensive overview of the top 10 companies in the market.
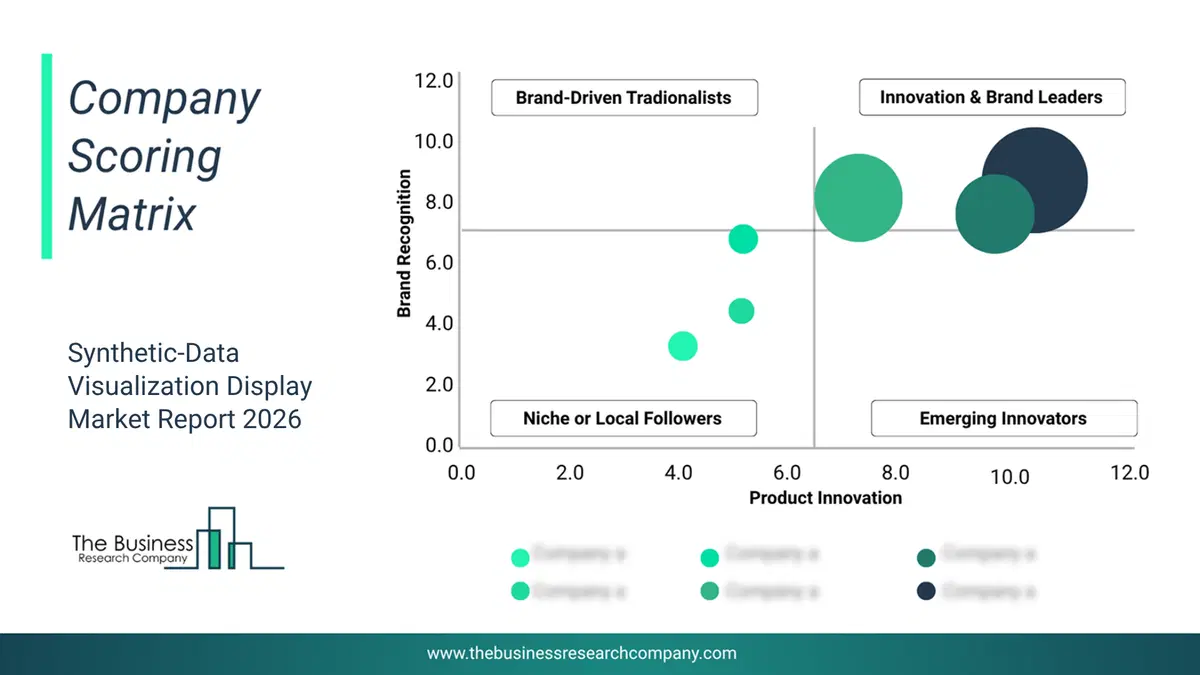
This chart maps companies by product innovation and brand strength, with bubble size indicating relative revenue, helping identify market leaders, challengers, and niche players. This is an illustrative chart; the full report provides a complete and accurate competitive analysis.
Global Synthetic-Data Visualization Display Market Trends and Insights
Major companies operating in the synthetic-data visualization display market are focusing on developing innovative solutions such as agentic AI to automate the creation and interpretation of synthetic datasets, enhancing data-driven insights and operational efficiency. Agentic AI refers to artificial intelligence systems capable of autonomous decision-making and action, allowing them to perform tasks, solve problems, and interact with environments or data independently with minimal human intervention. For instance, in October 2024, Tata Consultancy Services, an India-based IT company, launched a dedicated NVIDIA business unit within its AI.Cloud business unit to accelerate AI adoption for customers across various industries. Its AI.Cloud division aims to fast-track AI adoption across industries by combining TCS's deep domain expertise with NVIDIA's cutting-edge AI technologies. This unit delivers customized, industry-specific AI solutions that help enterprises innovate faster, optimize operations, and reduce costs significantly. Its purpose is to enable scalable, context-aware AI transformation using advanced NVIDIA platforms and TCS's proprietary frameworks for smarter, more efficient business outcomes.What Are Latest Mergers And Acquisitions In The Synthetic-Data Visualization Display Market?
In March 2024, Cisco Systems Incorporated, a US-based technology company, acquired Splunk Incorporated for an undisclosed amount. Through this acquisition, Cisco Systems Incorporated, aims to integrate Splunk's data analytics and security capabilities with its own to create a unified, AI-driven platform that enhances security, observability, and IT operations, accelerating revenue growth and strengthening its position in software and cybersecurity markets. Splunk Inc. is a US-based software company that offers synthetic-data visualization display solutions.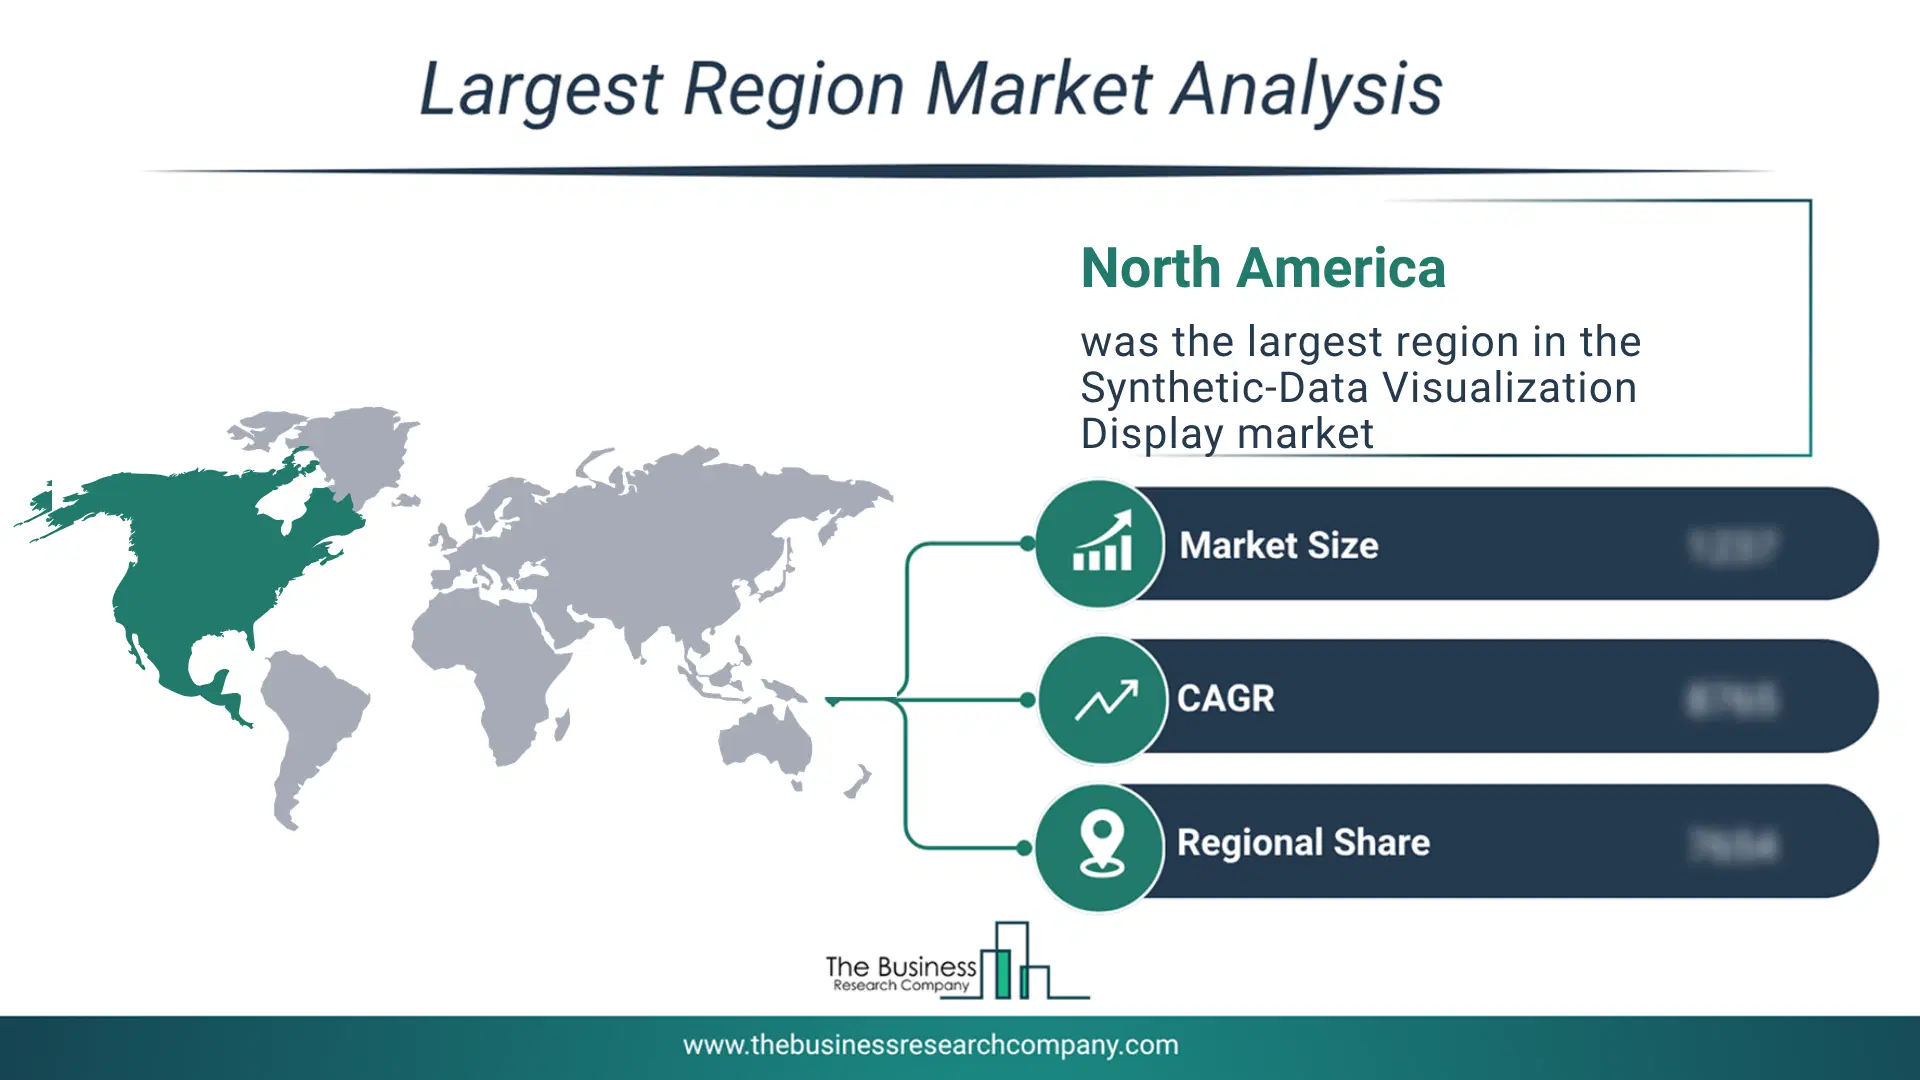
Regional Insights
North America was the largest region in the synthetic-data visualization display market in 2025. The regions covered in this market report are Asia-Pacific, South East Asia, Western Europe, Eastern Europe, North America, South America, Middle East, Africa. The countries covered in this market report are Australia, Brazil, China, France, Germany, India, Indonesia, Japan, Taiwan, Russia, South Korea, UK, USA, Canada, Italy, Spain.What Defines the Synthetic-Data Visualization Display Market?
The synthetic-data visualization display market consists of revenues earned by entities by providing services such as data analysis and exploration, visualization and reporting, and scenario simulation. The market value includes the value of related goods sold by the service provider or included within the service offering. The synthetic-data visualization display market also includes sales of synthetic data vault, YData fabric, and simulacra synthetic data studio. Values in this market are 'factory gate' values; that is, the value of goods sold by the manufacturers or creators of the goods, whether to other entities (including downstream manufacturers, wholesalers, distributors, and retailers) or directly to end customers. The value of goods in this market includes related services sold by the creators of the goods.How is Market Value Defined and Measured?
The market value is defined as the revenues that enterprises gain from the sale of goods and/or services within the specified market and geography through sales, grants, or donations in terms of the currency (in USD unless otherwise specified). The revenues for a specified geography are consumption values that are revenues generated by organizations in the specified geography within the market, irrespective of where they are produced. It does not include revenues from resales along the supply chain, either further along the supply chain or as part of other products.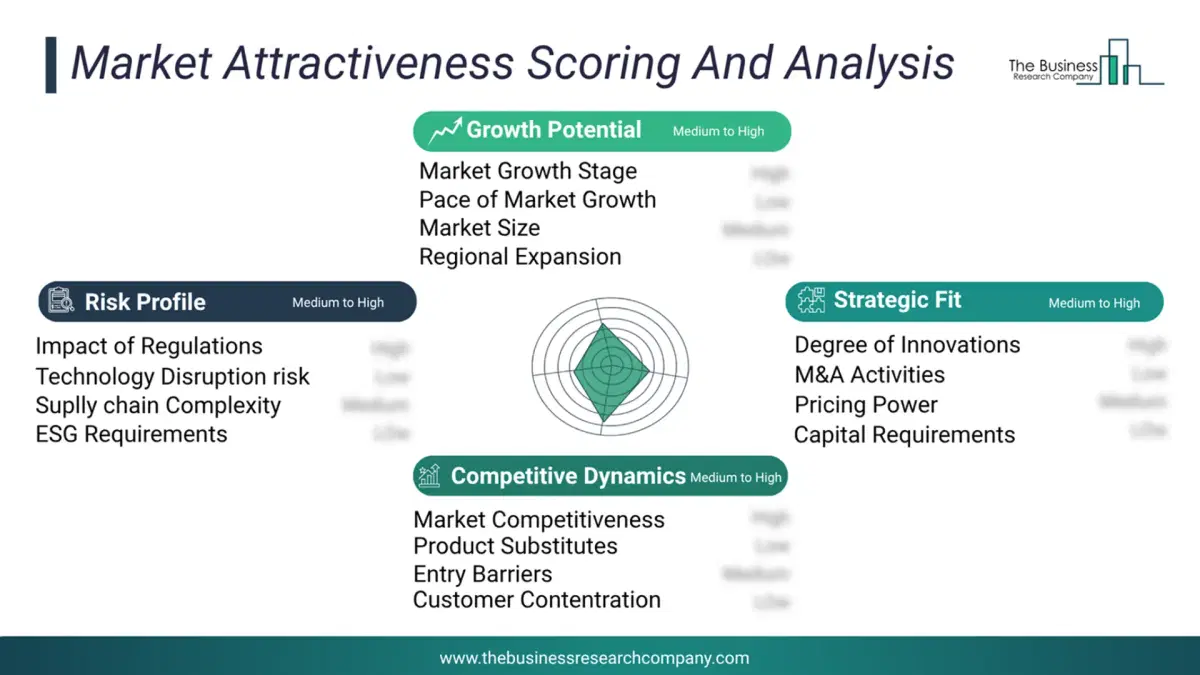
This chart presents market attractiveness based on a quantitative evaluation of growth, competition, strategic alignment, and risk, offering a clear view of opportunity areas for decision-making. This chart is for illustrative purposes; the full report contains the complete analysis.
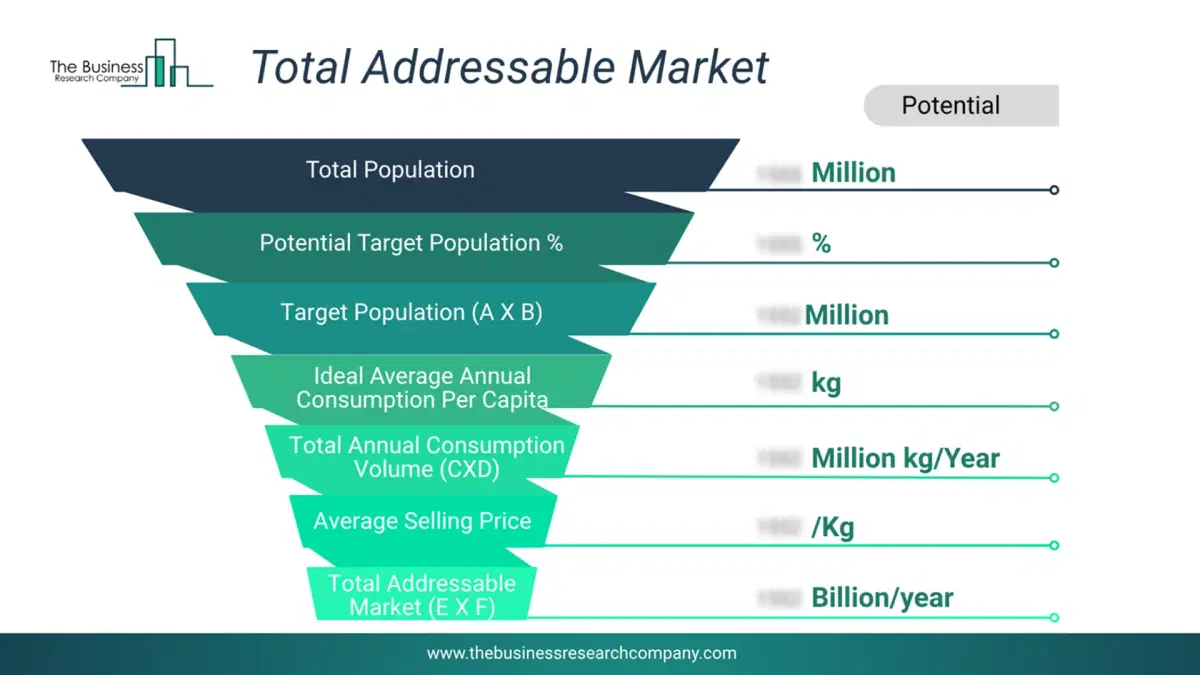
This chart highlights the Total Addressable Market (TAM) by estimating the maximum revenue opportunity using an assumption-driven approach, supporting strategic planning and opportunity sizing across markets. The chart is illustrative; the full report provides a more comprehensive analysis.
What Key Data and Analysis Are Included in the Synthetic-Data Visualization Display Market Report 2026?
The synthetic-data visualization display market research report is one of a series of new reports from The Business Research Company that provides market statistics, including industry global market size, regional shares, competitors with the market share, detailed market segments, market trends and opportunities, and any further data you may need to thrive in the synthetic-data visualization display industry. The market research report delivers a complete perspective of everything you need, with an in-depth analysis of the current and future state of the industry.Synthetic-Data Visualization Display Market Report Forecast Analysis
| Report Attribute | Details |
|---|---|
| Market Size Value In 2026 | $1.56 billion |
| Revenue Forecast In 2030 | $3.54 billion |
| Growth Rate | CAGR of 22.7% from 2026 to 2030 |
| Base Year For Estimation | 2025 |
| Actual Estimates/Historical Data | 2020-2025 |
| Forecast Period | 2026 - 2030 |
| Market Representation | Revenue in USD Billion and CAGR from 2026 to 2030 |
| Segments Covered | Component, Deployment Mode, Application, End-User |
| Regional Scope | Asia-Pacific, Western Europe, Eastern Europe, North America, South America, Middle East, Africa |
| Country Scope | The Countries Covered In This Market Report Are Australia, Brazil, China, France, Germany, India, Indonesia, Japan, Taiwan, Russia, South Korea, Uk, Usa, Canada, Italy, Spain. |
| Key Companies Profiled | Amazon Web Services Inc., Siemens AG, Nvidia Corp., Zoho Corporation, TIBCO Software Inc., ThoughtSpot Inc., Domo Inc., H2O.AI Inc., Tonic.ai, MOSTLY AI, Virtualitics Inc., Sky Engine, Infogram Inc., Sightwise, Bifrost AI Pte. Ltd., Looking Glass Factory Inc., Polymer Search Inc., Rendered.ai, Scale Synthetic, Syntheticus.AI |
| Customization Scope | Request for Customization |
| Pricing And Purchase Options | Explore Purchase Options |