

Power Infrastructure Market Report 2026
Global Outlook – By Type (Renewable, Non-Renewable), By Component (Generation, Transmission, Distribution), By Application (Industrial Power, Commercial Power, Residential Power), By End-User (Utilities, Independent Power Producers, Government, Other End-Users) – Market Size, Trends, Strategies, and Forecast to 2030
Power Infrastructure Market Overview
• Power Infrastructure market size has reached to $1559.08 billion in 2025 • Expected to grow to $2022.53 billion in 2030 at a compound annual growth rate (CAGR) of 5.3% • Growth Driver: The Increasing Adoption Of Renewable Energy Is Fueling The Growth Of The Market Due To Its Role In Driving Demand For Advanced Power Infrastructure And Enhancing Energy Transfer Efficiency • Market Trend: Next-Generation Battery Storage Innovations Drive Grid Efficiency And Renewable Integration • Asia-Pacific was the largest region in 2025.Market Gains By 2030 – Top Opportunities By Segment
Market Gain identifies the most promising market opportunities by highlighting the segments or products expected to generate the highest incremental revenue growth over the next five years.
What Is Covered Under Power Infrastructure Market?
Power infrastructure comprises the integrated systems and facilities responsible for generating, transmitting, distributing, and managing electricity. Its core function is to deliver a stable, efficient, and uninterrupted power supply. This infrastructure is essential for driving economic growth, improving living standards, and supporting technological advancement. Moreover, a robust power network is critical for maintaining essential services and ensuring national security. The main types of power infrastructure are renewable and non-renewable. Renewable power infrastructure generates electricity from sustainable sources, incorporating decentralized generation, grid integration, and storage to ensure reliability and reduce emissions. It includes components such as generation, transmission, and distribution for various applications, including industrial, commercial, and residential power. It is used by several end-users, including utilities, independent power producers, the government, and others.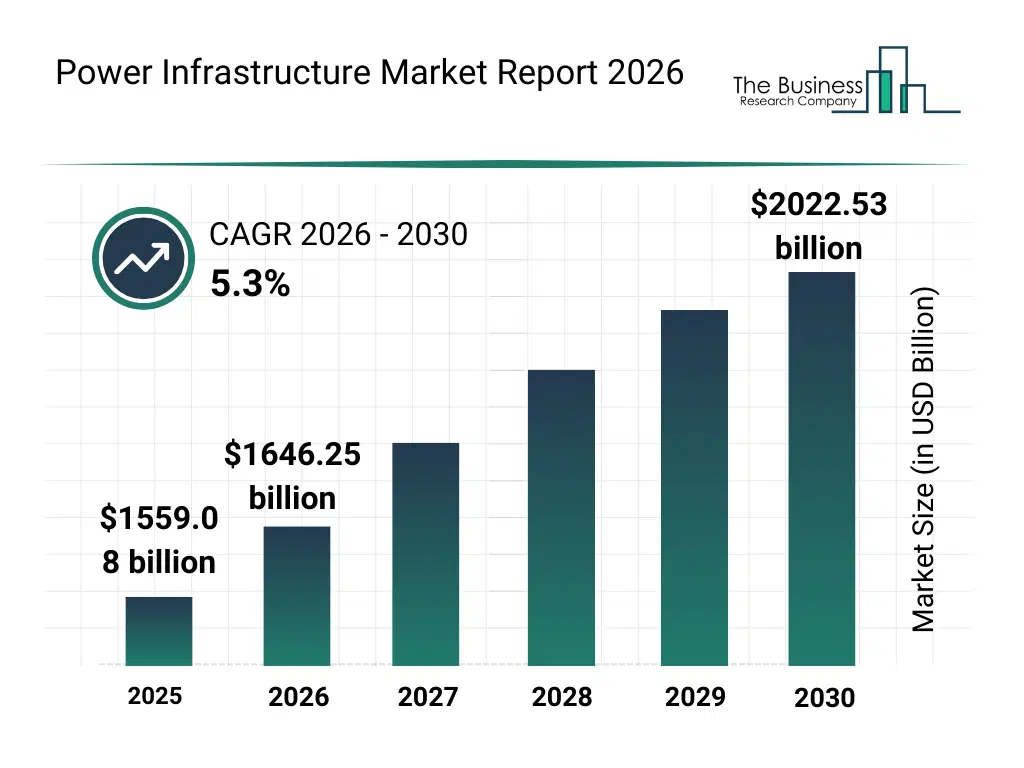
What Is The Power Infrastructure Market Size and Share 2026?
The power infrastructure market size has grown strongly in recent years. It will grow from $1559.08 billion in 2025 to $1646.25 billion in 2026 at a compound annual growth rate (CAGR) of 5.6%. The growth in the historic period can be attributed to expansion of centralized power generation capacity, development of national transmission networks, growth of urban electricity demand, electrification of industrial operations, availability of conventional grid technologies.What Is The Power Infrastructure Market Growth Forecast?
The power infrastructure market size is expected to see strong growth in the next few years. It will grow to $2022.53 billion in 2030 at a compound annual growth rate (CAGR) of 5.3%. The growth in the forecast period can be attributed to increasing renewable energy integration requirements, rising investments in grid modernization, expansion of electric vehicle charging infrastructure, growing adoption of distributed energy resources, increasing focus on cybersecurity in power networks. Major trends in the forecast period include increasing investments in smart grid infrastructure, rising deployment of renewable power assets, growing integration of digital grid management systems, expansion of transmission and distribution networks, enhanced focus on grid resilience and reliability.
Global Power Infrastructure Market Segmentation
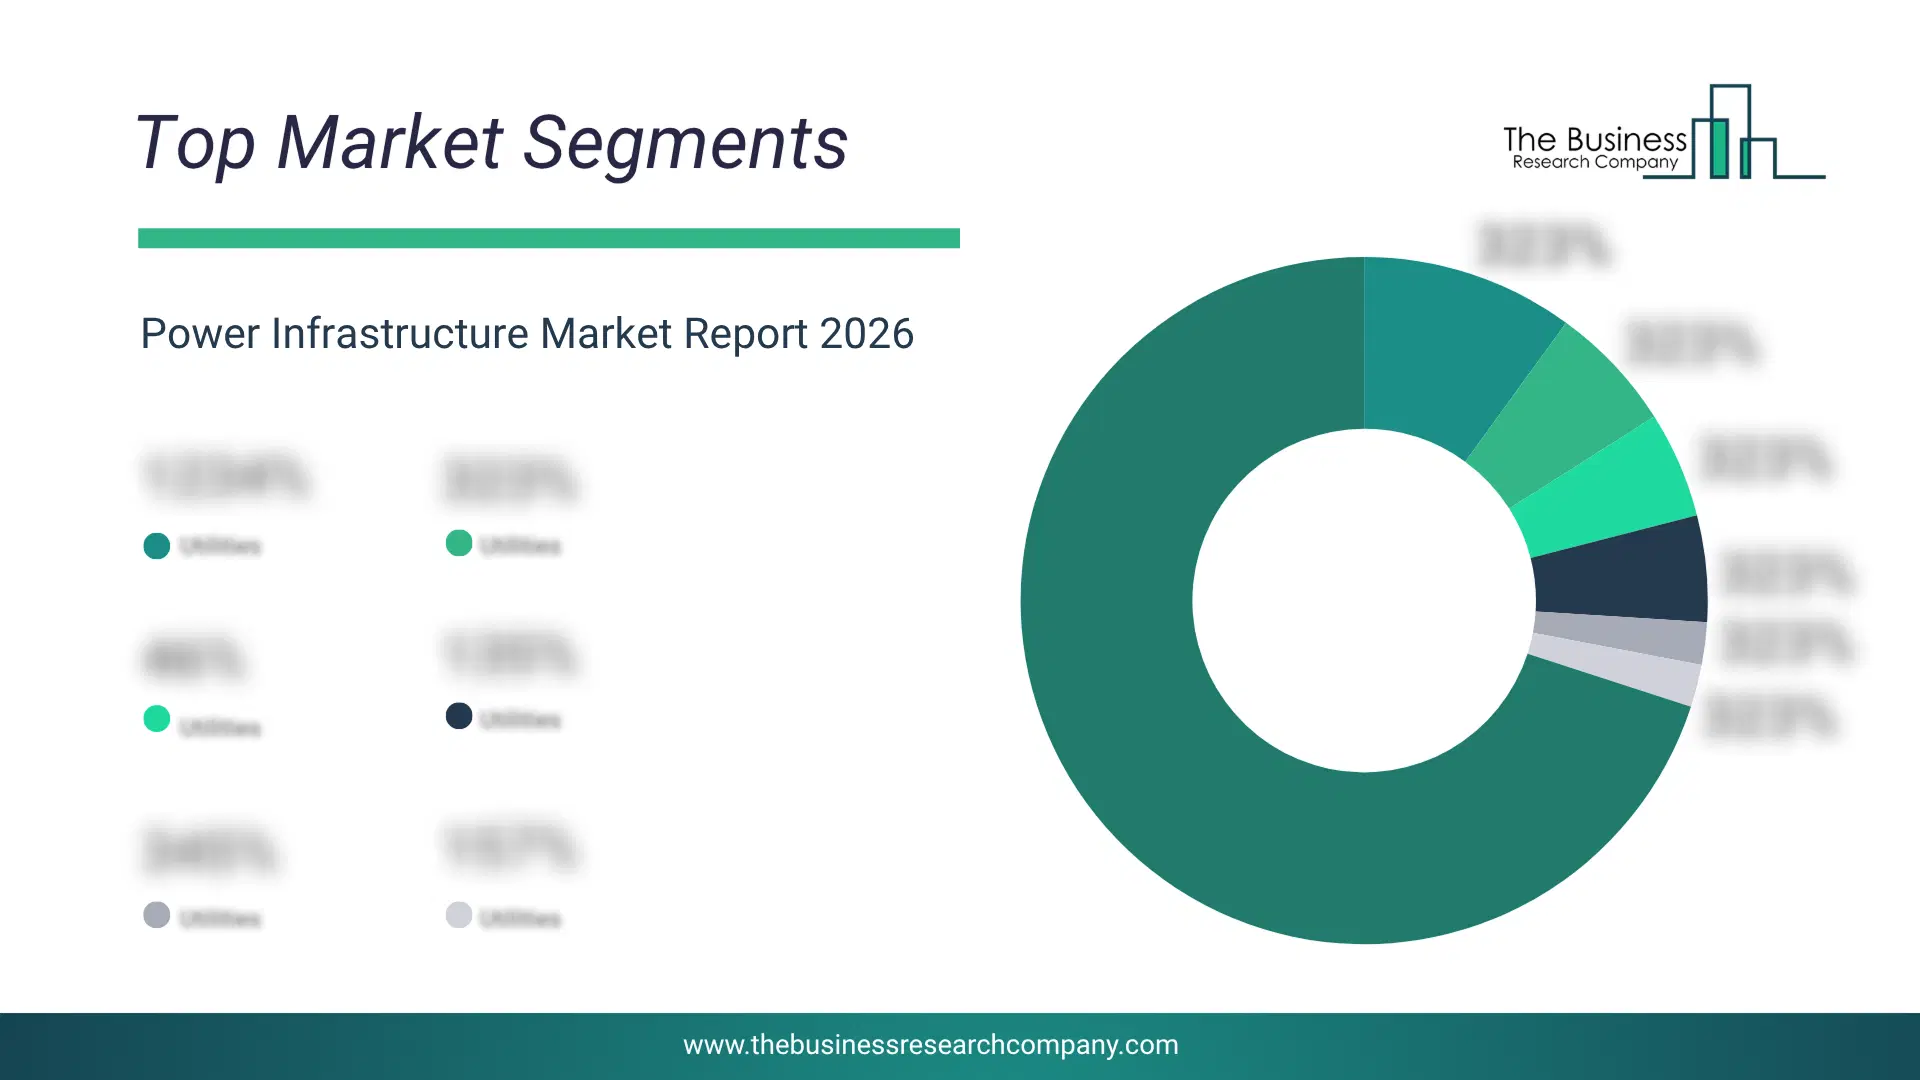
1) By Type: Renewable, Non-Renewable 2) By Component: Generation, Transmission, Distribution 3) By Application: Industrial Power, Commercial Power, Residential Power 4) By End-User: Utilities, Independent Power Producers, Government, Other End-Users Subsegments: 1) By Renewable: Solar Power, Wind Power, Hydropower, Biomass Energy, Geothermal Energy, Ocean Energy 2) By Non-Renewable: Coal-Based Power, Natural Gas Power, Nuclear Power, Oil-Based Power The top segments in the power infrastructure market will be: • Non-Renewable will reach $1278.03 Billion by 2030. • Renewable will reach $749.25 Billion by 2030.What Is The Driver Of The Power Infrastructure Market?
The increasing adoption of renewable energy is expected to propel the growth of the power infrastructure market going forward. Renewable energy is power generated from naturally replenished sources like sunlight, wind, and water. Renewable energy is rising as climate concerns push governments and industries to adopt cleaner sources and cut carbon emissions. Power infrastructure supports renewable energy by enabling efficient transmission, storage, and integration of variable energy sources such as solar and wind into the grid, ensuring reliable and stable energy delivery. For instance, in December 2024, according to the European Commission, a Belgium-based governing body, in 2023, renewable energy accounted for 24.5% of the EU's total energy consumption, marking an increase from 23.0% in 2022. Therefore, the increasing adoption of renewable energy is driving the growth of the power infrastructure industry.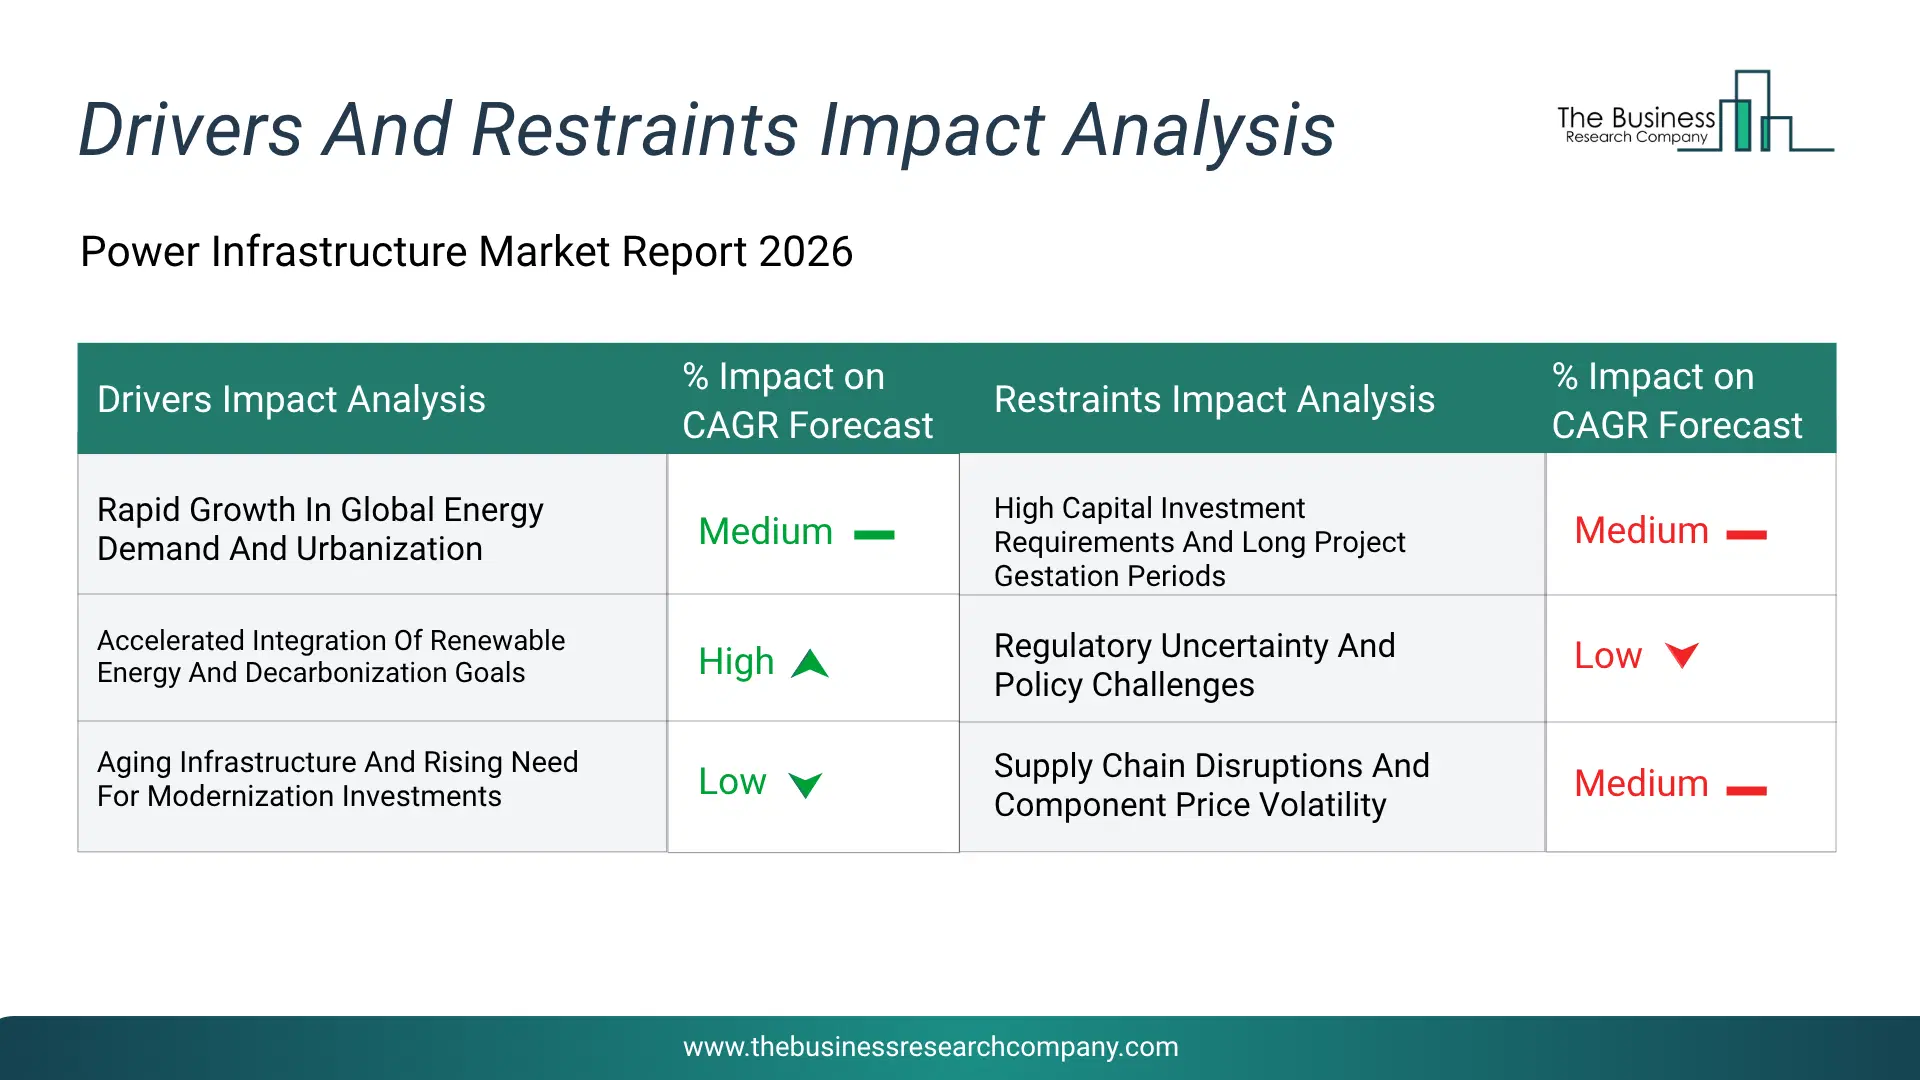
Infographic Chart Showing Key Market Drivers Analysis And Restraints For Power Infrastructure Market
The chart presents an impact analysis of key drivers and restraints, quantifying their relative influence on the market's growth rate and helping assess the balance between growth enablers and limiting factors. This chart offers a high-level perspective; the full report contains more detailed insights.
How Will The Drivers Impact Growth In The Global Power Infrastructure Market?
• Rapid Growth In Global Energy Demand And Urbanization (Medium) – During the forecast period, the rapid growth in global energy demand and urbanization is expected to become a key growth driver for the power infrastructure market by 2030. Expanding urban populations and increasing industrial activity are significantly raising electricity consumption across developing and developed regions. This surge in demand is driving investments in new power generation facilities, expansion of transmission networks, and strengthening of distribution systems to ensure reliable supply. Governments and utilities are focusing on scaling infrastructure capacity to meet peak load requirements and avoid power shortages. As cities continue to expand and energy needs intensify, infrastructure development is accelerating across multiple segments. • Accelerated Integration Of Renewable Energy And Decarbonization Goals (High) – During the forecast period, the accelerated integration of renewable energy and decarbonization goals is expected to emerge as a major factor driving the expansion of the power infrastructure market by 2030. Increasing deployment of solar, wind, and other clean energy sources is transforming traditional grid systems and requiring advanced infrastructure to manage variability and intermittency. Power systems are being redesigned to incorporate energy storage solutions, flexible transmission networks, and digital control technologies to balance supply and demand. Global commitments toward carbon neutrality are further pushing investments into cleaner energy infrastructure and grid integration capabilities. • Aging Infrastructure And Rising Need For Modernization Investments (Low) – During the forecast period, the aging infrastructure and rising need for modernization investments are expected to act as a key growth catalyst for the power infrastructure market by 2030. Many existing power grids and generation assets have been in operation for decades and require upgrades to maintain operational efficiency and reliability. Utilities are increasingly investing in replacing outdated equipment, upgrading substations, and deploying smart grid technologies to improve system performance. Modernization efforts are also focused on enhancing grid resilience against disruptions and integrating advanced monitoring systems. As infrastructure replacement cycles accelerate globally, capital expenditure on modernization projects is expected to rise steadily.How Will The Restraints Impact Growth In The Global Power Infrastructure Market?
• High Capital Investment Requirements And Long Project Gestation Periods (Medium) – During the forecast period, high Capital Investment Requirements And Long Project Gestation Periods Act As A Significant Restraint On The Power Infrastructure Market Because Developing And Expanding Power Systems Requires Large Upfront Funding. Building New Power Plants, Transmission Lines, And Distribution Networks Demands Substantial Financial Resources That Smaller Companies Or Developing Economies May Not Easily Secure. Extended Timeframes For Permits, Construction, And Testing Further Stretch Project Payback Periods, Reducing Investor Confidence And Appetite. These Long Gestation Cycles Can Slow Down Deployment And Delay Revenue Realization For Infrastructure Providers. Utilities And Governments May Prioritize Shorter‑Term Projects Over Comprehensive Grid Upgrades Due To Budget Constraints. Moreover, High Costs Can Lead To Higher Electricity Prices For End Users, Creating Political And Regulatory Pushback. Therefore, Capital Intensity And Long Development Cycles Act As Key Barriers To Faster Market Growth. • Regulatory Uncertainty And Policy Challenges (High) – During the forecast period, regulatory Uncertainty And Policy Challenges Act As A Restraint On The Power Infrastructure Market Because Inconsistent, Complex, Or Unpredictable Regulations Influence Long‑Term Planning And Investment Decisions. Differing Energy Policies Across Countries Or States Make It Difficult For Companies To Standardize Strategies And Allocate Capital Efficiently. Lengthy Approval And Permitting Processes Can Delay Construction And Increase Costs, Reducing The Attractiveness Of Large‑Scale Infrastructure Projects. Shifts In Incentives, Subsidies, Or Environmental Rules Create Uncertainty For Developers And Financiers Alike. Regulatory Hurdles Also Impact The Integration Of Renewables And Grid Upgrades When Policies Are Not Clearly Defined Or Stable. This Uncertainty Can Discourage New Entrants And Slow Down Market Expansion. As A Result, Policy Instability Acts As A Brake On Infrastructure Development And Investment Momentum. • Supply Chain Disruptions And Component Price Volatility (Low) – During the forecast period, supply Chain Disruptions And Component Price Volatility Act As A Major Restraint On The Power Infrastructure Market Because They Increase Costs And Delay The Delivery Of Crucial Equipment Like Transformers, Cables, And Switchgear. Global Supply Chain Bottlenecks Have Lengthened Lead Times For Key Components, Sometimes Doubling Procurement Duration, Which Slows Down Project Timelines. Rising Prices For Raw Materials And Finished Components Place Additional Financial Strain On Utilities And Infrastructure Developers. These Supply Issues Can Reduce Profit Margins And Lead To Project Postponements Or Cancellations When Costs Become Unsustainable. Smaller Suppliers And Contractors Are Particularly Vulnerable To Such Disruptions, Which Can Concentrate Supply Power In Larger Firms. Consequently, Market Growth And Infrastructure Deployment Are Constrained By These Ongoing Supply Chain Challenges.Key Players In The Global Power Infrastructure Market
Major companies operating in the power infrastructure market are Hitachi Ltd., General Electric Company, Mitsubishi Electric Corporation, Siemens Energy, ABB Ltd., Eaton Corporation, Quanta Services Inc., Prysmian Group, TBEA Co. Ltd., Nexans S.A, Tata Power Company Limited, CG Power and Industrial Solutions Limited, Powell Industries Inc., Efacec Power Solutions, Powin Energy, ENGIE UK, Suzlon Energy Ltd., Vestas Wind Systems, Orsted A/S, NextEra Energy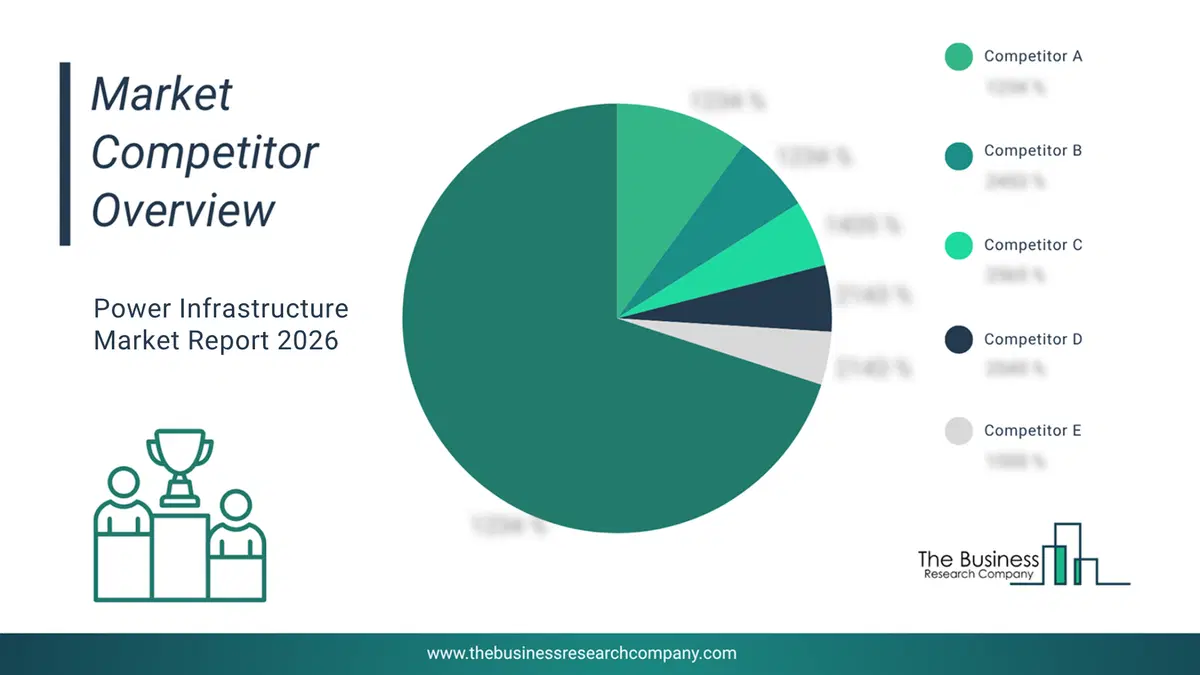
This chart is for illustrative purposes; the full report includes a detailed competitor analysis and comprehensive overview of the top 10 companies in the market.
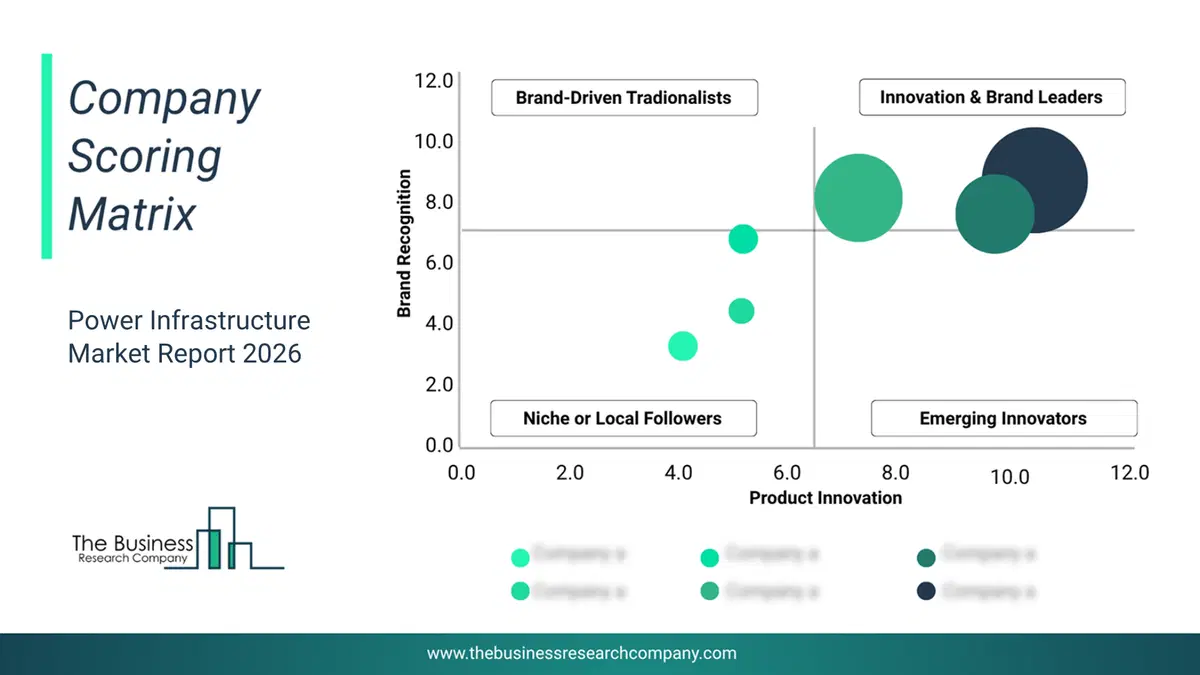
This chart maps companies by product innovation and brand strength, with bubble size indicating relative revenue, helping identify market leaders, challengers, and niche players. This is an illustrative chart; the full report provides a complete and accurate competitive analysis.
Global Power Infrastructure Market Trends and Insights
Major companies operating in the power infrastructure market are focusing on developing advanced solutions, such as advancements in battery energy storage systems, to enhance grid reliability and energy efficiency. Battery energy storage systems are advanced solutions designed to store large amounts of electricity in compact, scalable formats, enabling better integration of renewable energy and more flexible power management. For instance, in May 2024, Powin Corporation, a US-based energy storage technology company, launched the Powin Pod, a next-generation pod platform. The new pod platform delivers a 50% increase in energy density compared to Powin’s previous Centipede platform, features advanced safety measures such as liquid cooling and compliance with stringent fire prevention standards, and offers enhanced cost savings and reliability for customers. The Pod is part of a fully integrated solution, including Powin’s proprietary software and long-term service, and is available for global orders now and is scheduled for delivery beginning mid-2025, with U.S. manufacturing to start in 2026.What Are Latest Mergers And Acquisitions In The Power Infrastructure Market?
In May 2025, Macquarie Group Limited, an Australia-based provider of asset management and investment services across infrastructure and renewable energy sectors, acquired Island Green Power for an undisclosed amount. Throughthis acquisition, Macquarie Asset Management aimed to strengthen its renewable energy portfolio and accelerate the development of large-scale solar and green energy projects across key markets. Island Green Power Group Ltd is a UK-based company that offers power infrastructure.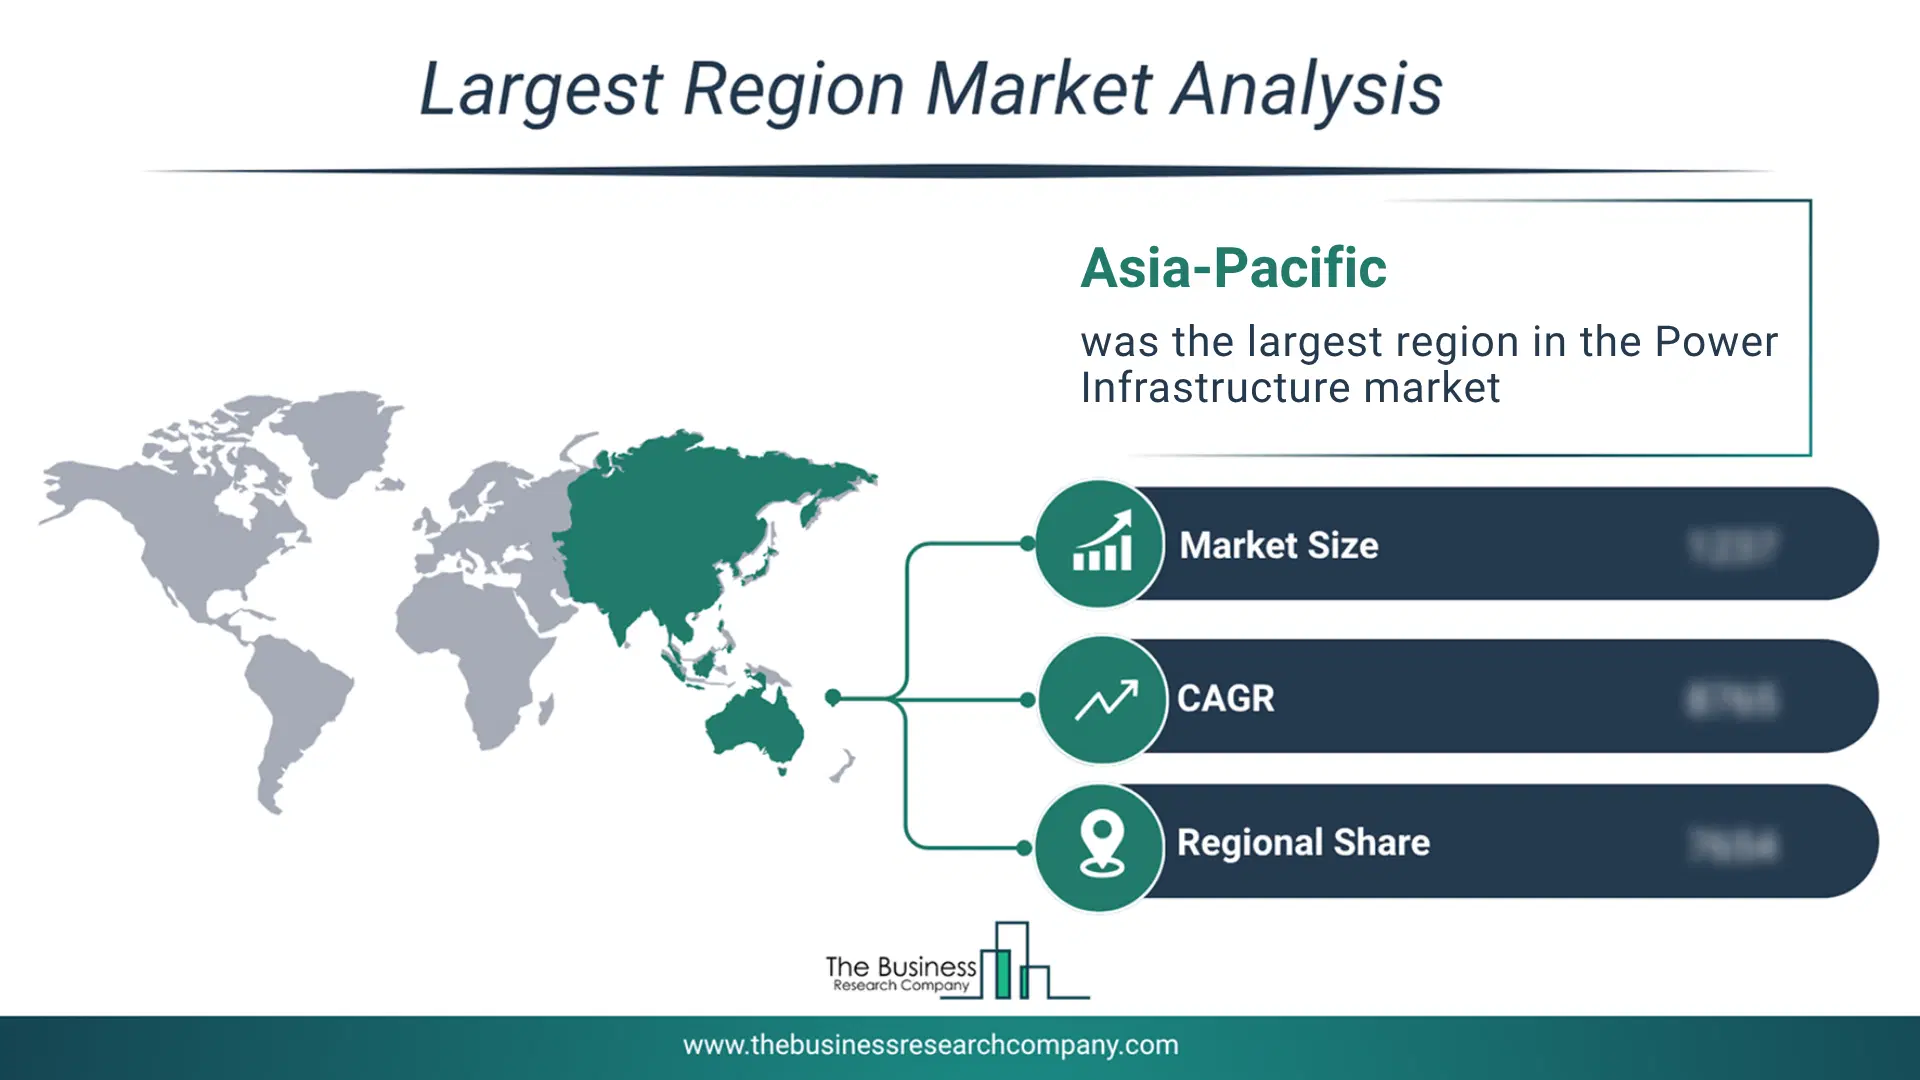
Regional Outlook
Asia-Pacific was the largest region in the power infrastructure market in 2025. The regions covered in this market report are Asia-Pacific, South East Asia, Western Europe, Eastern Europe, North America, South America, Middle East, Africa. The countries covered in this market report are Australia, Brazil, China, France, Germany, India, Indonesia, Japan, Taiwan, Russia, South Korea, UK, USA, Canada, Italy, SpainWhat Defines the Power Infrastructure Market?
The power infrastructure market consists of revenues earned by entities by providing services such as electricity generation, grid management, and equipment installation services. The market value includes the value of related goods sold by the service provider or included within the service offering. The power infrastructure market also includes sales of generators, turbines, wind turbine components, solar panels, and inverters. Values in this market are ‘factory gate’ values, that is, the value of goods sold by the manufacturers or creators of the goods, whether to other entities (including downstream manufacturers, wholesalers, distributors, and retailers) or directly to end customers. The value of goods in this market includes related services sold by the creators of the goods.How is Market Value Defined and Measured?
The market value is defined as the revenues that enterprises gain from the sale of goods and/or services within the specified market and geography through sales, grants, or donations in terms of the currency (in USD unless otherwise specified). The revenues for a specified geography are consumption values that are revenues generated by organizations in the specified geography within the market, irrespective of where they are produced. It does not include revenues from resales along the supply chain, either further along the supply chain or as part of other products.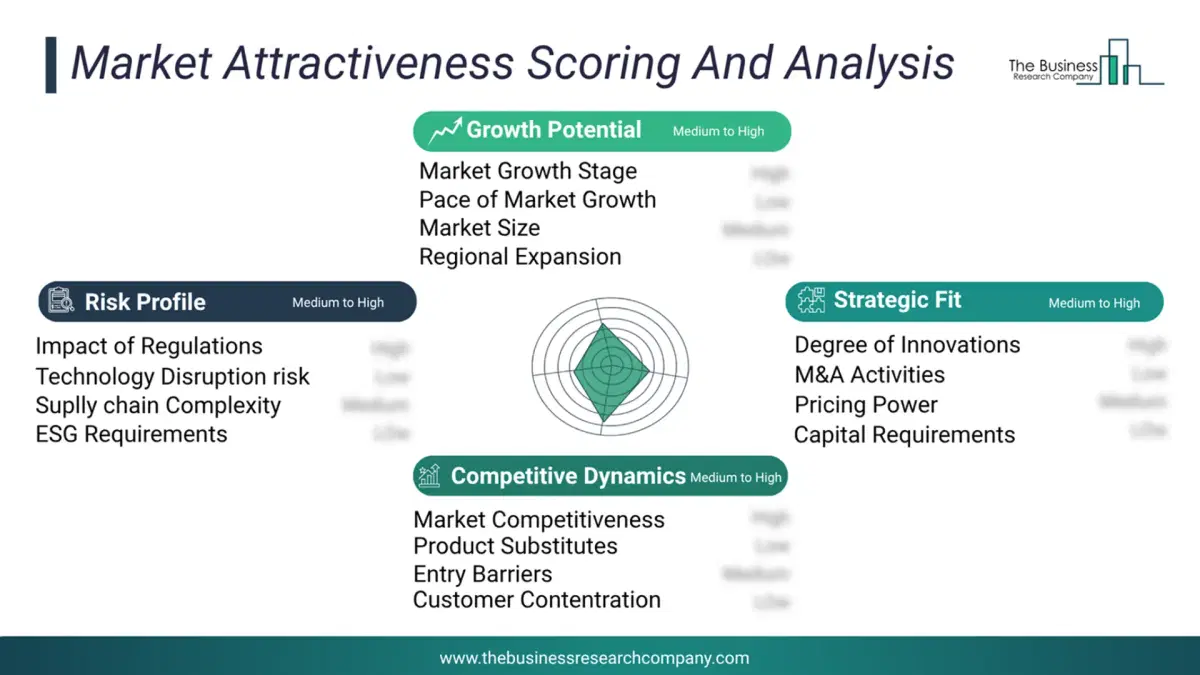
This chart presents market attractiveness based on a quantitative evaluation of growth, competition, strategic alignment, and risk, offering a clear view of opportunity areas for decision-making. This chart is for illustrative purposes; the full report contains the complete analysis.
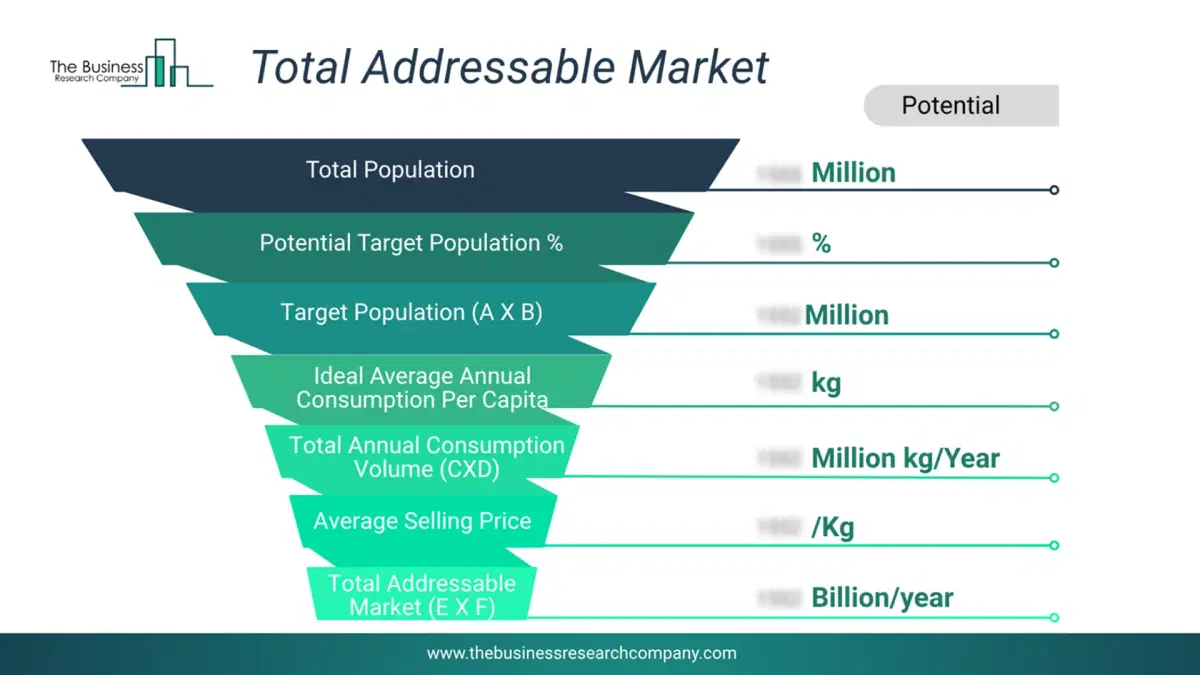
This chart highlights the Total Addressable Market (TAM) by estimating the maximum revenue opportunity using an assumption-driven approach, supporting strategic planning and opportunity sizing across markets. The chart is illustrative; the full report provides a more comprehensive analysis.
What Key Data and Analysis Are Included in the Power Infrastructure Market Report 2026?
The power infrastructure market research report is one of a series of new reports from The Business Research Company that provides market statistics, including Market Report 2026?global market size, regional shares, competitors with the market share, detailed market segments, market trends and opportunities, and any further data you may need to thrive in the power infrastructure Market Report 2026? The market research report delivers a complete perspective of everything you need, with an in-depth analysis of the current and future state of the Market Report 2026?Power Infrastructure Market Report Forecast Analysis
| Report Attribute | Details |
|---|---|
| Market Size Value In 2026 | $1646.25 billion |
| Revenue Forecast In 2030 | $2022.53 billion |
| Growth Rate | CAGR of 5.6% from 2026 to 2030 |
| Base Year For Estimation | 2025 |
| Actual Estimates/Historical Data | 2020-2025 |
| Forecast Period | 2026 - 2030 |
| Market Representation | Revenue in USD Billion and CAGR from 2026 to 2030 |
| Segments Covered | Type, Component, Application, End-User |
| Regional Scope | Asia-Pacific, Western Europe, Eastern Europe, North America, South America, Middle East, Africa |
| Country Scope | The countries covered in the report are Australia, Brazil, China, France, Germany, India, Indonesia, Japan, Taiwan, Russia, South Korea, UK, USA, Canada, Italy, Spain. |
| Key Companies Profiled | Hitachi Ltd., General Electric Company, Mitsubishi Electric Corporation, Siemens Energy, ABB Ltd., Eaton Corporation, Quanta Services Inc., Prysmian Group, TBEA Co. Ltd., Nexans S.A, Tata Power Company Limited, CG Power and Industrial Solutions Limited, Powell Industries Inc., Efacec Power Solutions, Powin Energy, ENGIE UK, Suzlon Energy Ltd., Vestas Wind Systems, Orsted A/S, NextEra Energy |
| Customization Scope | Request for Customization |
| Pricing And Purchase Options | Explore Purchase Options |