
Expense Tracker Apps Market Report 2026
Global Outlook – By Platform (Mobile Apps, Web-Based Apps), By Subscription Model (Freemium, Premium), By Functionality (Basic Expense Tracker, Finance Analytics, Receipt Scanning And Management), By End User (Personal, Business) – Market Size, Trends, Strategies, and Forecast to 2030
Expense Tracker Apps Market Overview
• Expense Tracker Apps market size has reached to $10.86 billion in 2025 • Expected to grow to $19.77 billion in 2030 at a compound annual growth rate (CAGR) of 12.7% • Growth Driver: Rising Smartphone User Penetration Driving Growth In The Expense Tracker App Market • Market Trend: Advanced Expense Management Solutions Driving Financial Efficiency • North America was the largest region in 2025 and Asia-Pacific is the fastest growing region.Market Gains By 2030 – Top Opportunities By Segment
Market Gain identifies the most promising market opportunities by highlighting the segments or products expected to generate the highest incremental revenue growth over the next five years.
What Is Covered Under Expense Tracker Apps Market?
Expense tracker apps refer to software tools that allow people or businesses to monitor and manage their financial transactions. These apps often allow users to track their income, expenses, and other financial transactions, giving them insight into their spending habits, budgeting, and overall financial health. The main types of platforms for expense tracker apps include mobile apps and web-based apps. Mobile apps refer to software programs designed to be installed and used on mobile devices, such as smartphones and tablets. Various subscription models are included, such as freemium and premium, with several functionalities, including a basic expense tracker, finance analytics, and receipt scanning and management. These are used by several end users, including personal and business.
What Is The Expense Tracker Apps Market Size and Share 2026?
The expense tracker apps market size has grown rapidly in recent years. It will grow from $10.86 billion in 2025 to $12.26 billion in 2026 at a compound annual growth rate (CAGR) of 12.8%. The growth in the historic period can be attributed to growth in smartphone penetration, rising consumer focus on personal financial management, expansion of digital payment usage, increased availability of mobile applications, growing awareness of budgeting tools.What Is The Expense Tracker Apps Market Growth Forecast?
The expense tracker apps market size is expected to see rapid growth in the next few years. It will grow to $19.77 billion in 2030 at a compound annual growth rate (CAGR) of 12.7%. The growth in the forecast period can be attributed to increasing demand for ai-driven financial insights, rising adoption of subscription-based finance apps, expansion of small business usage of expense trackers, growing focus on financial wellness, increasing integration with open banking ecosystems. Major trends in the forecast period include increasing adoption of mobile-based personal finance tools, rising use of automated budgeting and analytics features, growing integration with digital banking platforms, expansion of receipt scanning and ocr capabilities, enhanced focus on user-friendly financial interfaces.

Global Expense Tracker Apps Market Segmentation
1) By Platform: Mobile Apps, Web-Based Apps 2) By Subscription Model: Freemium, Premium 3) By Functionality: Basic Expense Tracker, Finance Analytics, Receipt Scanning And Management 4) By End User: Personal, Business Subsegments: 1) By Mobile Apps: Personal Expense Tracking Apps, Business Expense Management Apps, Integrated Personal Finance Apps, Mileage And Travel Expense Apps, Receipt Capture And Smart Scanning Apps 2) By Web-Based Apps: SME Expense Management Platforms, Enterprise Expense And Spend Control Platforms, Accounting-Integrated Expense Platforms, Budgeting And Financial Analytics Platforms, Multi-User Collaboration Expense Platforms The top segments in the expense tracker apps market will be: • Mobile Apps will reach $14.23 Billion by 2030. • Web-Based Apps will reach $5.41 Billion by 2030.What Is The Driver Of The Expense Tracker Apps Market?
Increasing smartphone user penetration is expected to propel the growth of the expense tracker app market going forward. Smartphone user penetration refers to the percentage of the population that uses smartphones among the total population. The number of smartphone users is rising due to several factors, such as affordability, internet connectivity, social and cultural trends, and expanding mobile ecosystems. Expense tracker apps allow users to record and categorize expenses, create budgets, and obtain insights into their spending habits through their smartphones or tablets. Mobile users can set up the expense tracker app to send reminders and notifications about future payments, budget limitations, and unusual spending trends. For instance, in November 2024, according to Red Search, Australia-Based SEO (search engine optimization) agency, the number of smartphone users in Australia is projected to grow by 3.7 million, reaching a total of 23.6 million by 2026. Therefore, the increasing smartphone user penetration is driving the growth of the expense tracking app market.
Infographic Chart Showing Key Market Drivers Analysis And Restraints For Expense Tracker Apps Market
The chart presents an impact analysis of key drivers and restraints, quantifying their relative influence on the market's growth rate and helping assess the balance between growth enablers and limiting factors. This chart offers a high-level perspective; the full report contains more detailed insights.
How Will The Drivers Impact Growth In The Global Expense Tracker Apps Market?
• Increasing Penetration Of Smartphones And Fintech Innovations (Medium) – During the forecast period, the increasing penetration of smartphones and fintech innovations is expected to become a key growth driver for the expense tracker apps market by 2030. The increasing penetration of smartphones and fintech innovations is significantly driving the growth of the expense tracker apps market by making digital financial management more accessible and convenient for consumers. The widespread availability of affordable smartphones and internet connectivity has enabled users to monitor expenses anytime and anywhere through mobile applications. Fintech advancements such as digital wallets, mobile banking, UPI payments, AI-based budgeting tools, and automated transaction categorization are enhancing the functionality of expense tracker apps. These innovations improve user experience by providing real-time spending insights, personalized financial recommendations, and seamless synchronization with banking platforms. Additionally, the growing adoption of cashless transactions is generating large volumes of digital financial data that can be easily integrated into tracking applications. Younger consumers and tech-savvy users are increasingly relying on such apps to manage daily spending and savings goals efficiently. As digital financial ecosystems continue to expand globally, demand for smart and connected expense tracking solutions is expected to rise steadily. • Increasing Demand For Automation (High) – During the forecast period, the increasing demand for automation is expected to emerge as a major factor driving the expansion of the expense tracker apps market by 2030. Increasing demand for automation is acting as a major driver for the expense tracker apps market as users seek efficient ways to manage personal and business finances with minimal manual effort. Modern expense tracker applications automate processes such as expense recording, transaction categorization, bill reminders, receipt scanning, and budget analysis, reducing the time and complexity associated with financial management. Automation improves accuracy by minimizing human errors in expense calculation and reporting. Businesses and freelancers are increasingly adopting automated expense management tools to streamline reimbursement processes and financial documentation. The integration of artificial intelligence and machine learning further strengthens automation capabilities by delivering predictive spending analysis and smart budgeting suggestions. Consumers are also preferring automated tracking systems because they provide instant updates and better financial visibility. As demand for productivity-enhancing digital tools continues to increase, automated expense tracking solutions are witnessing strong market adoption across both individual and enterprise users. • Rising Demand For Sophisticated Cost Management Solutions (Medium) – During the forecast period, the rising demand for sophisticated cost management solutions is expected to act as a key growth catalyst for the expense tracker apps market by 2030. Rising demand for sophisticated cost management solutions is driving the expense tracker apps market as individuals and organizations increasingly focus on improving financial planning and spending control. Consumers are seeking advanced applications that offer detailed analytics, customized budgeting tools, financial forecasting, and multi-account integration to better understand their financial behavior. Businesses are adopting sophisticated expense management platforms to monitor operational costs, optimize expenditures, and improve financial transparency across departments. Advanced features such as cloud-based reporting, real-time dashboards, AI-driven insights, and integration with accounting software are enhancing the value proposition of these applications. The growing complexity of financial transactions and increasing use of digital payment systems are also encouraging users to adopt smarter cost management tools. Additionally, the need for efficient financial decision-making during economic uncertainties is accelerating the use of data-driven expense tracking platforms. This increasing emphasis on intelligent financial management is expected to support continuous market growth over the forecast period.How Will The Restraints Impact Growth In The Global Expense Tracker Apps Market?
• Data Privacy Concerns (Medium) – During the forecast period, the data privacy concerns are acting as a major restraint for the expense tracker apps market because these applications handle highly sensitive financial and personal information, including banking details, transaction histories, and spending patterns. Users are often hesitant to share financial data with third-party applications due to fears of data breaches, identity theft, and unauthorized access. Increasing cybersecurity threats and hacking incidents have further reduced consumer confidence in digital financial platforms. In addition, strict data protection regulations and compliance requirements increase operational complexity for app providers. Many small and medium-sized developers face challenges in implementing advanced encryption and security infrastructure, which can limit market expansion. Concerns regarding misuse of customer data for advertising or analytics purposes also discourage adoption among privacy-conscious users. As trust and security remain critical factors in financial applications, rising privacy concerns may slow the widespread adoption of expense tracker apps. • Market Saturation (High) – During the forecast period, the market saturation is restraining the growth of the expense tracker apps market due to the presence of a large number of similar applications offering overlapping features and services. The increasing availability of free and low-cost expense management apps has intensified competition among market players, making customer acquisition and retention more difficult. Many consumers already use pre-installed banking applications or digital wallet platforms that provide basic expense tracking functions, reducing the need for separate apps. The crowded competitive landscape also limits pricing flexibility and profit margins for developers. Smaller companies often struggle to differentiate their products through innovation, resulting in slower user growth. In mature markets, high penetration of financial management applications further reduces opportunities for rapid expansion. As competition continues to rise, sustaining long-term user engagement and market share becomes increasingly challenging for expense tracker app providers. • Integration Issues (Medium) – During the forecast period, the integration issues are limiting the growth of the expense tracker apps market because many applications face difficulties in connecting seamlessly with diverse banking systems, payment platforms, accounting software, and financial institutions. Differences in APIs, security standards, and regional banking regulations can create compatibility problems that affect user experience and functionality. Inconsistent synchronization of financial data may result in inaccurate expense records, delayed transaction updates, or incomplete reporting. Businesses and professional users particularly require smooth integration with enterprise accounting and payroll systems, making interoperability essential for adoption. Technical integration challenges also increase development and maintenance costs for app providers. Additionally, frequent updates in banking technologies and fintech platforms require continuous software modifications, creating operational complexity. These integration barriers can reduce customer satisfaction and discourage users from relying fully on expense tracker applications for financial management.Key Players In The Global Expense Tracker Apps Market
Major companies operating in the expense tracker apps market are Intuit Inc, Expensify Inc, You Need A Budget LLC, PocketGuard Inc, Everlance Inc, Hurdlr Inc, FreshBooks, Wave Financial Inc, Emburse Holdings Inc, Shoeboxed Inc, Spendesk, Tiller LLC, Zoho Corporation Pvt. Ltd, Xero Limited, Abacus Labs Inc, Ramsey Solutions Inc, Realbyte Inc, WalletIQ Inc, ClearCheckbook, Money Dashboard, Goodbudget, Money Lover
This chart is for illustrative purposes; the full report includes a detailed competitor analysis and comprehensive overview of the top 10 companies in the market.

This chart maps companies by product innovation and brand strength, with bubble size indicating relative revenue, helping identify market leaders, challengers, and niche players. This is an illustrative chart; the full report provides a complete and accurate competitive analysis.
Global Expense Tracker Apps Market Trends and Insights
Major companies operating in the expense tracker apps market are focused on developing advanced products, such as expense management solutions, to enhance financial control and efficiency and gain a competitive edge in the market. Expense management solutions are software platforms that simplify and automate the process of tracking, submitting, authorizing, and reimbursing business expenses. For instance, in July 2023, Justworks, a US-based software company that provides software and expert support for payroll, benefits, HR, and compliance, launched Expenses, an expense management tool for its PEO (Professional Employer Organization) customers. This tool is aimed at streamlining cost reimbursement and payroll processing. The application enables administrators to create approval workflows and unique rules, making the reconciliation process easier for accountants. Employees can easily create expenses using the Justworks mobile app by taking photos of receipts. The company created Expenses to combine tools, reduce errors, and deliver an intuitive, simple solution that does not require additional expense management software.What Are Latest Mergers And Acquisitions In The Expense Tracker Apps Market?
In March 2024, BetterCloud, a US-based software company, acquired G2 Track from G2.com, Inc. for an undisclosed amount. This acquisition empowers BetterCloud's customers with enhanced visibility and automation tools, positioning IT to act as a trusted advisor in tech spend decisions, fostering efficient growth across organizations. G2.com, Inc. is a US-based business software and service offering spend and expense tracking software.
Regional Outlook
North America was the largest region in the expense tracker apps market in 2025. Asia-Pacific is expected to be the fastest-growing region in the forecast period. The regions covered in this market report are Asia-Pacific, South East Asia, Western Europe, Eastern Europe, North America, South America, Middle East, Africa. The countries covered in this market report are Australia, Brazil, China, France, Germany, India, Indonesia, Japan, Taiwan, Russia, South Korea, UK, USA, Canada, Italy, Spain.What Defines the Expense Tracker Apps Market?
The expense tracker apps market includes revenues earned by entities by providing services such as receipt scanning, bank account integration, reporting and analytics, bill reminders, and customization options. The market value includes the value of related goods sold by the service provider or included within the service offering. Only goods and services traded between entities or sold to end consumers are included.How is Market Value Defined and Measured?
The market value is defined as the revenues that enterprises gain from the sale of goods and/or services within the specified market and geography through sales, grants, or donations in terms of the currency (in USD unless otherwise specified). The revenues for a specified geography are consumption values that are revenues generated by organizations in the specified geography within the market, irrespective of where they are produced. It does not include revenues from resales along the supply chain, either further along the supply chain or as part of other products.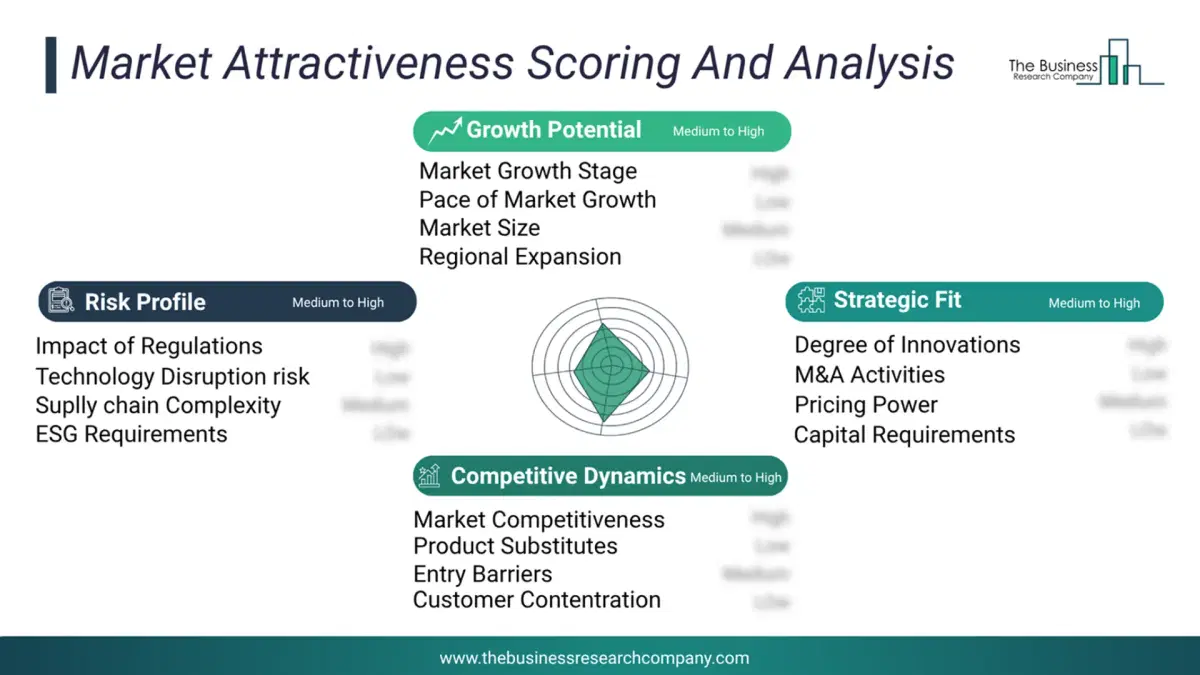
This chart presents market attractiveness based on a quantitative evaluation of growth, competition, strategic alignment, and risk, offering a clear view of opportunity areas for decision-making. This chart is for illustrative purposes; the full report contains the complete analysis.
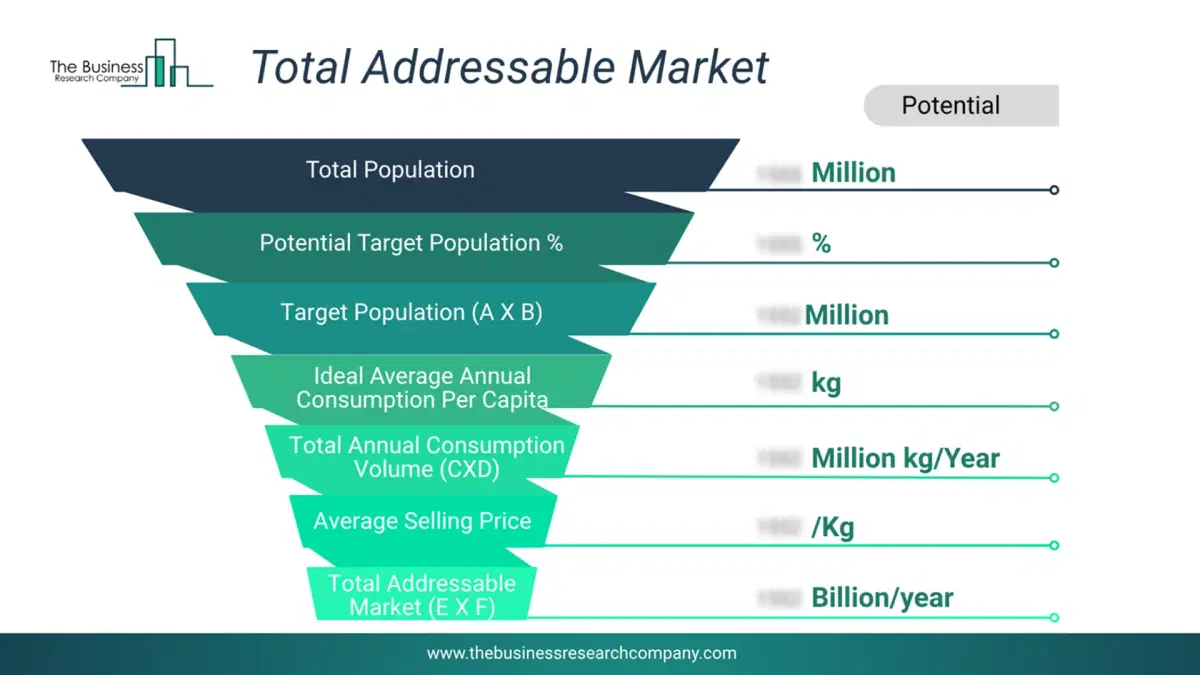
This chart highlights the Total Addressable Market (TAM) by estimating the maximum revenue opportunity using an assumption-driven approach, supporting strategic planning and opportunity sizing across markets. The chart is illustrative; the full report provides a more comprehensive analysis.
What Key Data and Analysis Are Included in the Expense Tracker Apps Market Report 2026?
The expense tracker apps market research report is one of a series of new reports from The Business Research Company that provides market statistics, including Market Report 2026?global market size, regional shares, competitors with the market share, detailed market segments, market trends and opportunities, and any further data you may need to thrive in the expense tracker apps Market Report 2026? The market research report delivers a complete perspective of everything you need, with an in-depth analysis of the current and future state of the Market Report 2026?Expense Tracker Apps Market Report Forecast Analysis
| Report Attribute | Details |
|---|---|
| Market Size Value In 2026 | $12.26 billion |
| Revenue Forecast In 2030 | $19.77 billion |
| Growth Rate | CAGR of 12.8% from 2026 to 2030 |
| Base Year For Estimation | 2025 |
| Actual Estimates/Historical Data | 2020-2025 |
| Forecast Period | 2026 - 2030 |
| Market Representation | Revenue in USD Billion and CAGR from 2026 to 2030 |
| Segments Covered | Platform, Subscription Model, Functionality, End User |
| Regional Scope | Asia-Pacific, Western Europe, Eastern Europe, North America, South America, Middle East, Africa |
| Country Scope | The countries covered in the report are Australia, Brazil, China, France, Germany, India, Indonesia, Japan, Taiwan, Russia, South Korea, UK, USA, Canada, Italy, Spain. |
| Key Companies Profiled | Intuit Inc, Expensify Inc, You Need A Budget LLC, PocketGuard Inc, Everlance Inc, Hurdlr Inc, FreshBooks, Wave Financial Inc, Emburse Holdings Inc, Shoeboxed Inc, Spendesk, Tiller LLC, Zoho Corporation Pvt. Ltd, Xero Limited, Abacus Labs Inc, Ramsey Solutions Inc, Realbyte Inc, WalletIQ Inc, ClearCheckbook, Money Dashboard, Goodbudget, Money Lover |
| Customization Scope | Request for Customization |
| Pricing And Purchase Options | Explore Purchase Options |