
OTT Streaming Market Report 2026
Global Outlook – By Device Type (Smartphones, Smart TV's, Laptops, Desktops and Tablets, Gaming Consoles, Set-Top Box, Other Devices), By Revenue Source (AVOD, SVOD, TVOD, Other Revenue Sources), By User Type (Commercial, Personal), By End User (E-commerce, Media And Entertainment, Education And Training, IT And Telecom, Health And Fitness, Other End Users) – Market Size, Trends, Strategies, and Forecast to 2030
OTT Streaming Market Overview
• OTT Streaming market size has reached to $221.03 billion in 2025 • Expected to grow to $551.19 billion in 2030 at a compound annual growth rate (CAGR) of 20.1% • Growth Driver: Increasing Availability Of High Speed Internet Fueling The Growth Of The OTT Streaming Market • Market Trend: Increasing Focus On Technological Innovations To Drive The Revenues In The Market • Asia-Pacific was the largest region in 2025 and Middle East is the fastest growing region.Market Gains By 2030 – Top Opportunities By Segment
Market Gain identifies the most promising market opportunities by highlighting the segments or products expected to generate the highest incremental revenue growth over the next five years.
What Is Covered Under OTT Streaming Market?
OTT Streaming refers to delivering video content over the internet without the need for traditional cable or satellite subscriptions. It is used to provide viewers with on-demand access to movies, TV shows, and live broadcasts via platforms like Netflix, Hulu, and Amazon Prime Video. This technology enables greater flexibility and convenience for consumers in how they consume media. The main types of devices in OTT streaming are smartphones, smart TVs, laptops, desktops and tablets, gaming consoles, set-top boxes, and others. Smartphone refers to a handheld electronic device that will provide a connection to a cellular network. The different revenue sources include AVOD, SVOD, TVOD, others and involve various user types such as commercial, personal. It is used in several sectors including E-commerce, media, and entertainment, education and training, it and telecom, health and fitness, others.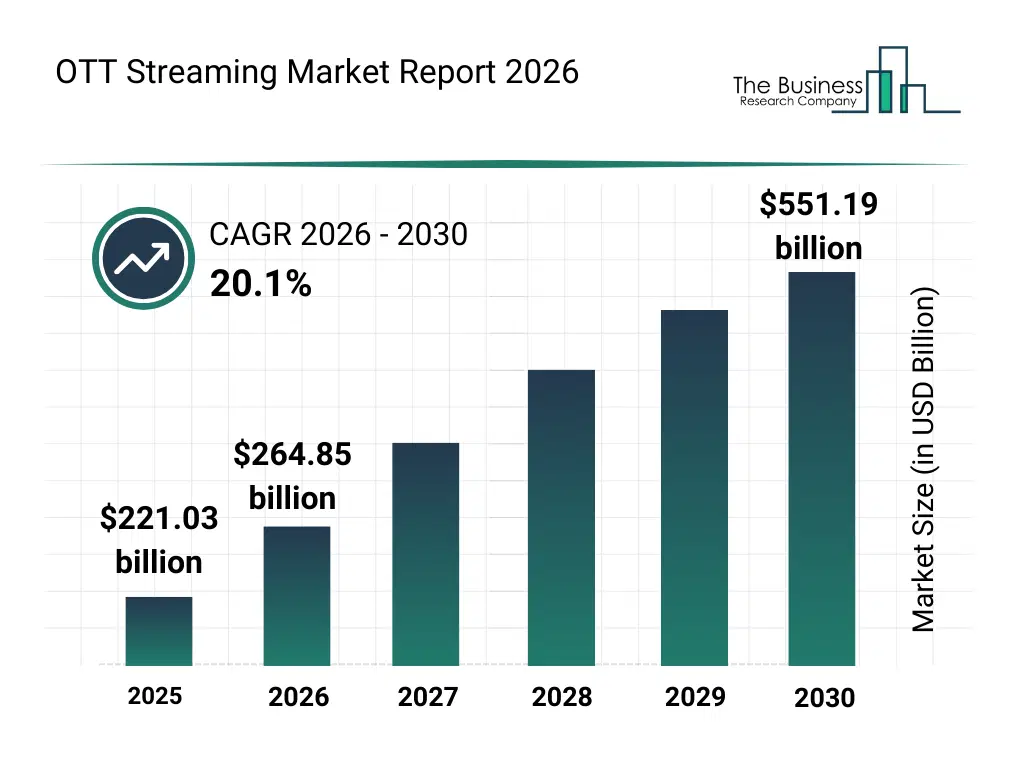
What Is The OTT Streaming Market Size and Share 2026?
The ott streaming market size has grown rapidly in recent years. It will grow from $221.03 billion in 2025 to $264.85 billion in 2026 at a compound annual growth rate (CAGR) of 19.8%. The growth in the historic period can be attributed to increased internet penetration, growth of smart devices, rise of video-on-demand consumption, expansion of broadband infrastructure, adoption of connected TVs.What Is The OTT Streaming Market Growth Forecast?
The ott streaming market size is expected to see exponential growth in the next few years. It will grow to $551.19 billion in 2030 at a compound annual growth rate (CAGR) of 20.1%. The growth in the forecast period can be attributed to growth in mobile streaming, demand for personalized content, expansion of regional content libraries, integration with social media platforms, adoption of 5g networks. Major trends in the forecast period include personalized content recommendation, multi-screen viewing experience, subscription fatigue management, regional content localization, interactive live streaming.
Global OTT Streaming Market Segmentation
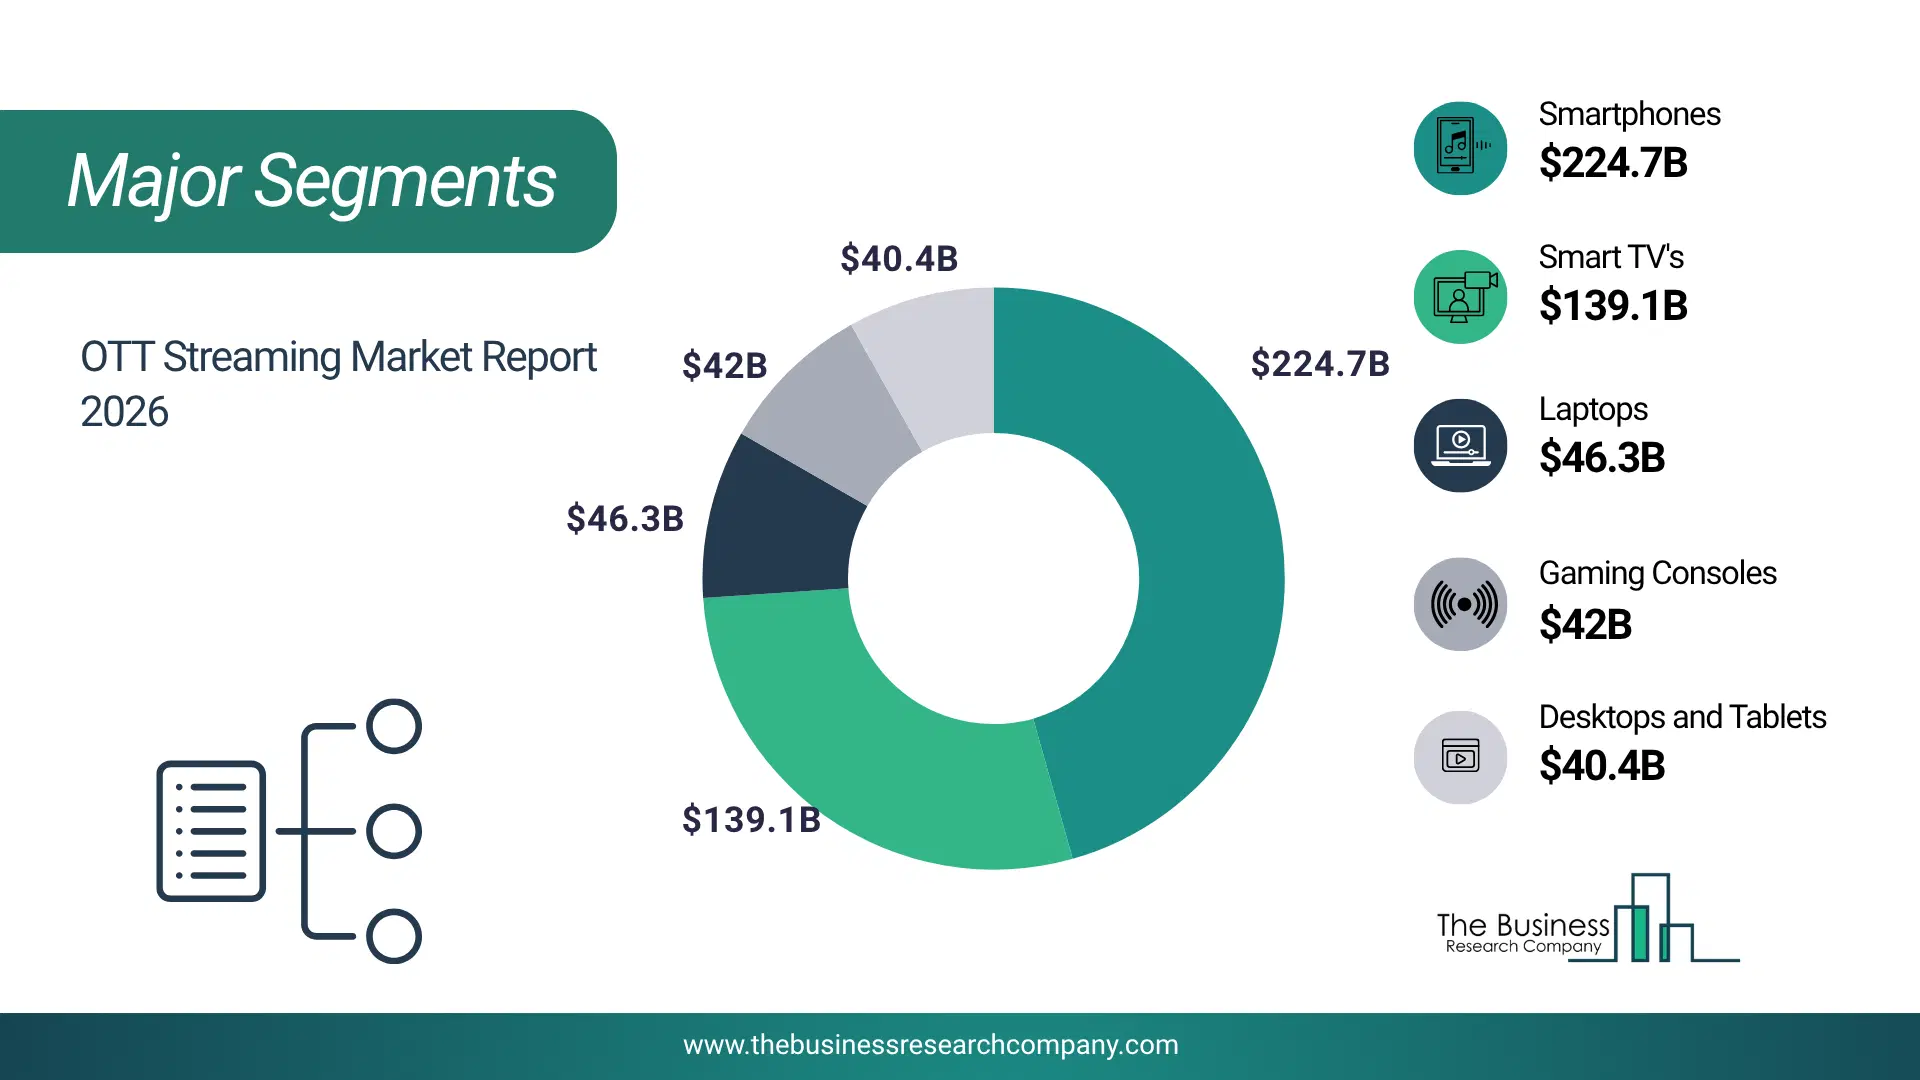
1) By Device Type: Smartphones, Smart TV's, Laptops, Desktops and Tablets, Gaming Consoles, Set-Top Box, Other Devices 2) By Revenue Source: AVOD, SVOD, TVOD, Other Revenue Sources 3) By User Type: Commercial, Personal 4) By End User: E-commerce, Media And Entertainment, Education And Training, IT And Telecom, Health And Fitness, Other End Users Subsegments: 1) By Smartphones: Android Phones, IPhones 2) By Smart TVs: Android TVs, Roku TVs, Fire TVs 3) By Laptops: Windows Laptops, MacBooks, Chromebooks 4) By Desktops And Tablets: Windows Desktops, IMacs, IPads, Android Tablets 5) By Gaming Consoles: PlayStation, Xbox, Nintendo 6) By Set-Top Box: Roku, Apple TV, Amazon Fire TV 7) By Other Devices: Projectors, Streaming Sticks The top segments in the ott streaming market will be: • Smartphones will reach $224.67 billion by 2030. • Smart TV's will reach $139.08 billion by 2030. • Laptops will reach $46.29 billion by 2030. • Gaming Consoles will reach $41.96 billion by 2030. • Desktops and Tablets will reach $40.34 billion by 2030.What Is The Driver Of The OTT Streaming Market?
The increasing availability of high speed internet is expected to propel the growth of the over the top (OTT) streaming market going forward. High speed internet refers to broadband connections that provide faster data transmission speeds compared with traditional dial up access, enabling seamless streaming of high-quality video content across multiple devices. The expansion of fixed broadband and mobile internet infrastructure, including fiber and 5G networks, is making it easier for people to access OTT platforms, attracting new subscribers and increasing engagement among existing users. For instance, in January 2024, according to the Eurostat, a Luxembourg-based government agency, in 2023, 30% of EU internet users aged 16 to 74 reported engaging in an online course or using online learning materials within the past three months. This marks a 2-percentage point increase from 2022, when the figure was 28%. Overall, participation in online education saw an increase in 2023 compared to 2022. Therefore, the increasing availability of high speed internet is driving the growth of the OTT streaming industry.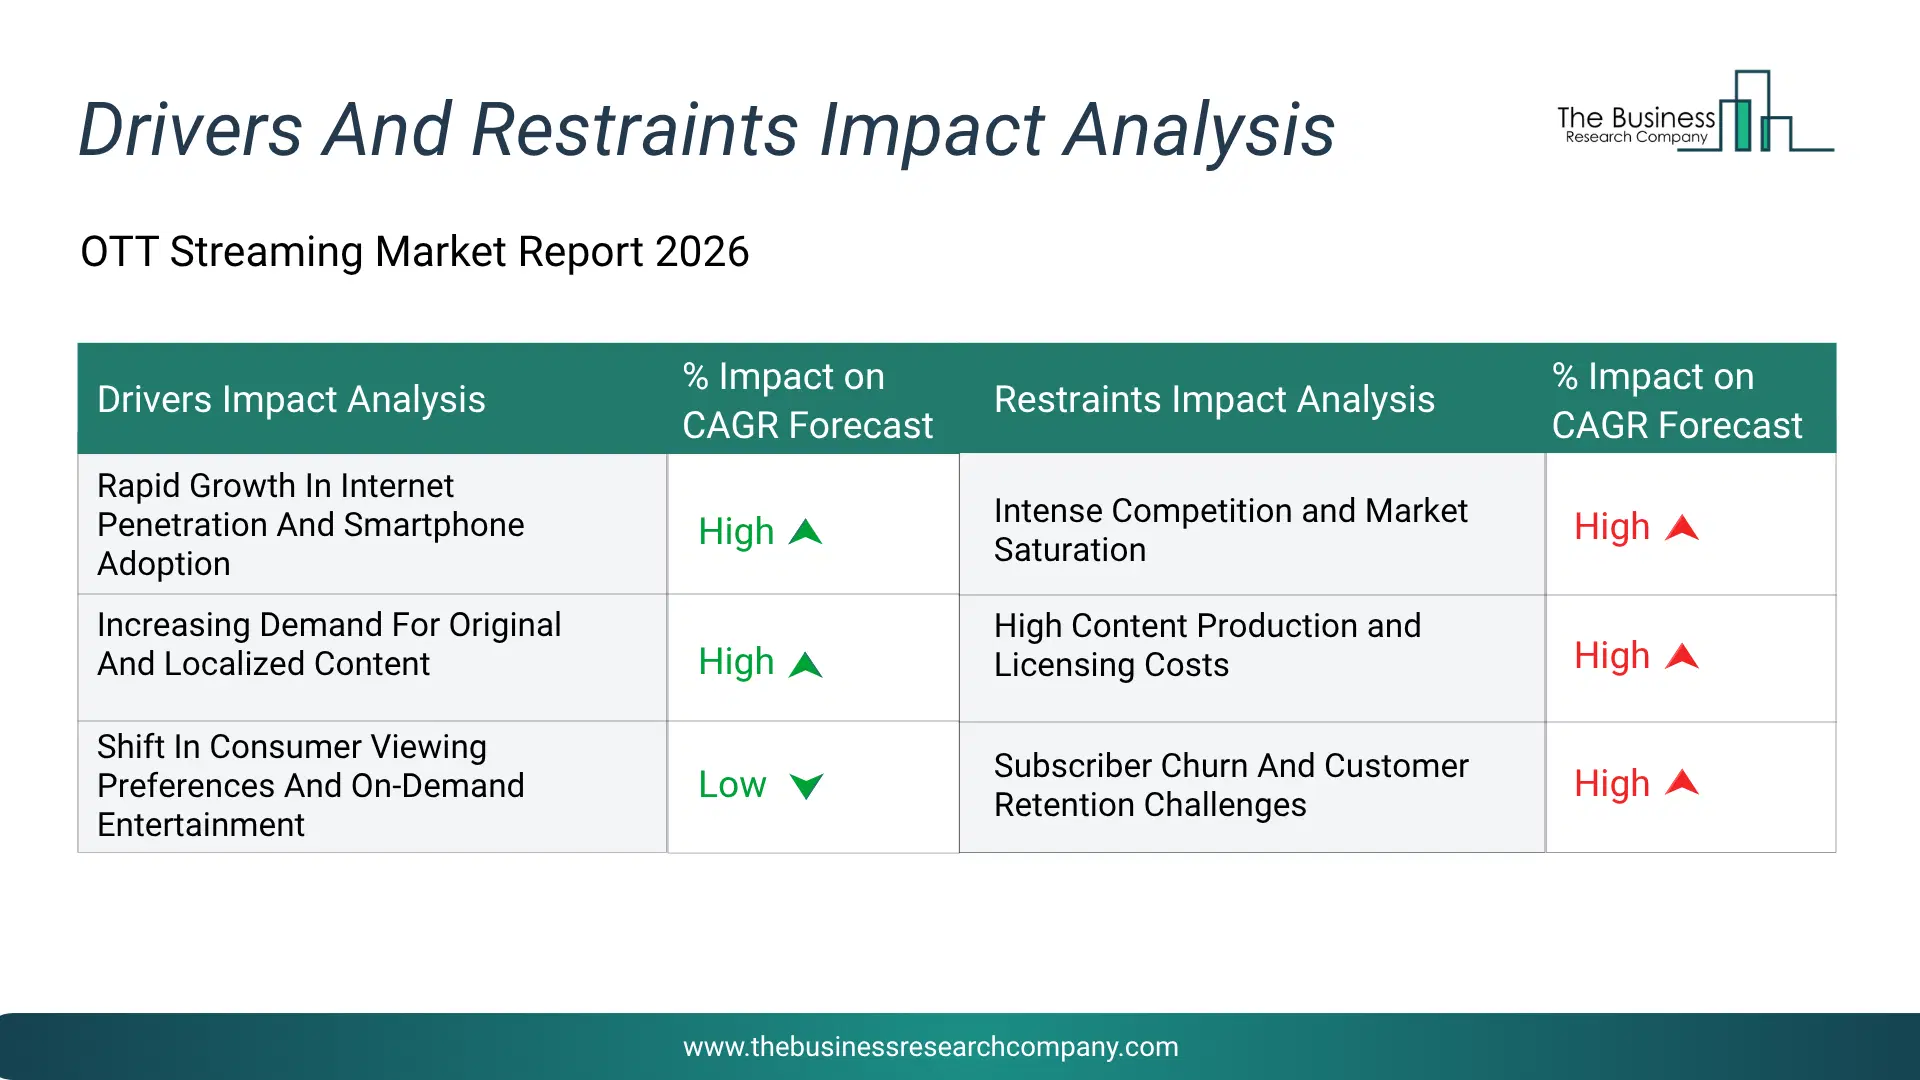
Infographic Chart Showing Key Market Drivers Analysis And Restraints For Ott Streaming Market
The chart presents an impact analysis of key drivers and restraints, quantifying their relative influence on the market's growth rate and helping assess the balance between growth enablers and limiting factors. This chart offers a high-level perspective; the full report contains more detailed insights.
How Will The Drivers Impact Growth In The Global OTT Streaming Market?
• Rapid Growth In Internet Penetration And Smartphone Adoption (High) – During the forecast period, the rapid growth in internet penetration and smartphone adoption is expected to become a key growth driver for the ott streaming market by 2030. The exponential rise in internet penetration and smartphone usage worldwide is significantly driving the ott streaming market. With faster 4g and 5g networks, consumers now have the ability to stream high -quality video content anytime and anywhere. Smartphones, tablets, smart tvs, and connected devices have made content consumption highly convenient, increasing the adoption of subscription -based and ad -supported ott platforms. This connectivity boom enables both regional and global ott services to reach wider audiences, thereby fueling market growth as more consumers shift from traditional cable or satellite tv to on -demand streaming platforms. • Increasing Demand For Original And Localized Content (High) – During the forecast period, the increasing demand for original and localized content is expected to emerge as a major factor driving the expansion of the ott streaming market by 2030. Ott platforms are heavily investing in original, exclusive, and localized content to attract and retain subscribers. Viewers are seeking diverse entertainment options, including regional movies, web series, documentaries, sports, and live events tailored to their cultural preferences. This trend has led to a surge in content production across languages and genres, providing ott platforms a competitive edge. By offering personalized recommendations and engaging content, platforms enhance viewer satisfaction and subscription rates. The increasing consumer demand for fresh, relevant, and locally resonant content is a major driver for the ott streaming market globally. • Shift In Consumer Viewing Preferences And On-Demand Entertainment (Low) – During the forecast period, the shift in consumer viewing preferences and on-demand entertainment is expected to act as a key growth catalyst for the ott streaming market by 2030. Changing lifestyles, urbanization, and busy work schedules are encouraging consumers to prefer on-demand video consumption over traditional tv. Ott platforms allow viewers to watch content anytime, pause and resume shows, and binge-watch entire series, offering unparalleled flexibility. The shift toward personalized and convenient entertainment experiences, including mobile streaming, multi-device access, and interactive features, is increasing the adoption of ott services. This evolving consumer behavior acts as a key growth driver, enabling streaming platforms to expand their subscriber base and enhance revenue opportunities.How Will The Restraints Impact Growth In The Global OTT Streaming Market?
• Intense Competition and Market Saturation (High) – During the forecast period, the the ott streaming market is becoming increasingly crowded, with global giants like netflix, disney+, amazon prime video, and regional players competing for subscribers. Intense competition often leads to aggressive pricing strategies, discounts, and content spending wars, which can impact profitability. Market saturation in developed regions may limit growth opportunities, forcing platforms to continuously innovate and expand to emerging markets. These competitive pressures act as a restraint, making it challenging for new entrants to capture significant market share without substantial investment in content and marketing. • High Content Production and Licensing Costs (High) – During the forecast period, the ott platforms must invest heavily in content creation, licensing popular films, acquiring sports rights, and producing original series to attract viewers. These high expenditures increase operational costs and may affect profitability, especially for smaller or emerging platforms. Additionally, content rights negotiations and licensing fees vary across regions, creating financial and strategic challenges. Such high costs act as a key restraint on market growth, particularly in regions where consumer subscription affordability is limited. • Subscriber Churn And Customer Retention Challenges (High) – During the forecast period, the ott platforms face significant challenges in retaining subscribers due to the growing number of competing services. Consumers frequently switch platforms based on content availability, pricing, and promotional offers. High churn rates increase customer acquisition costs and reduce revenue predictability. Maintaining subscriber loyalty requires continuous investment in content and user experience improvements.Key Players In The Global OTT Streaming Market
Major companies operating in the ott streaming market are Amazon.com Inc., Apple Inc., Alphabet Inc., Google LLC, Microsoft Corporation, AT&T Inc., The Walt Disney Company, Tencent Holdings Limited, Discovery Inc., Netflix Inc., Paramount Global, Disney DTC LLC, Sling TV LLC, ESPN Inc., Rakuten Inc., Telstra Corporation Limited, WarnerMedia LLC, Hulu LLC, Kakao Corporation, Lions Gate Entertainment Corp., Roku Inc., AMC Networks Inc., Peacock TV LLC, fuboTV Inc., ViacomCBS Pvt. Ltd., IndieFlix Group Inc., Philo Inc., Vudu Inc., BBC Studios and ITV plc, CuriosityStream Inc., Crunchyroll LLC, Funimation Global Group LLC, Kanopy Inc., MUBI Inc., Tubi Inc., Comcast Corporation, Zee Entertainment Enterprises Limited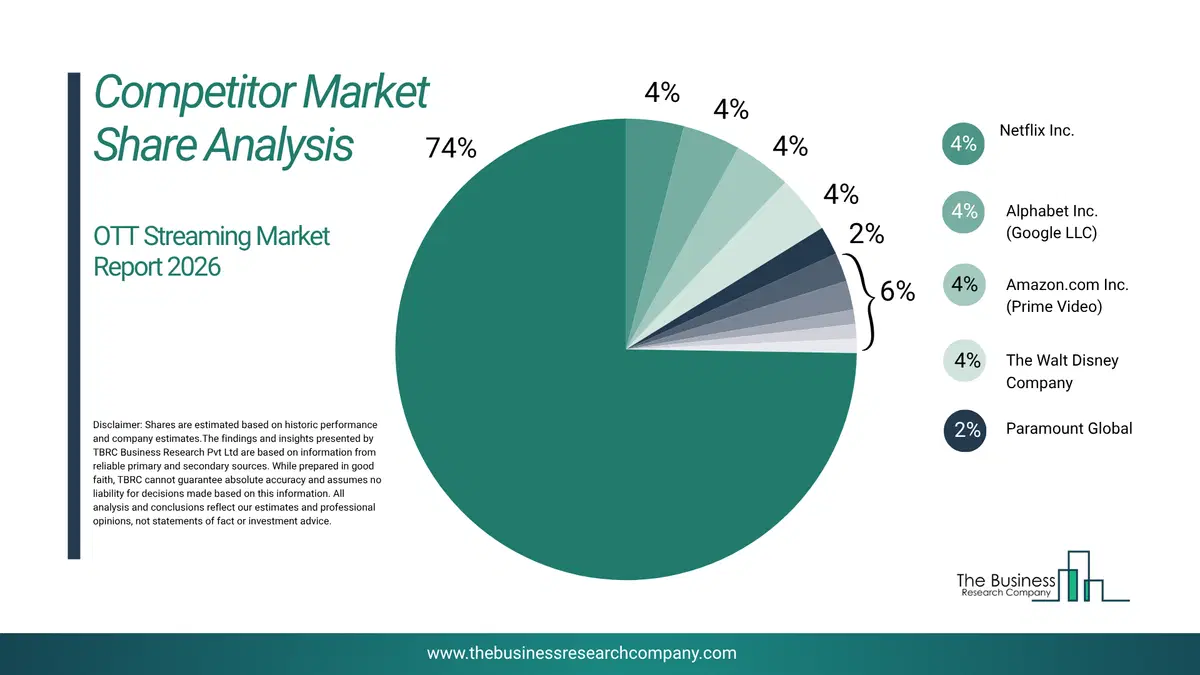
This chart is for illustrative purposes; the full report includes a detailed competitor analysis and comprehensive overview of the top 10 companies in the market.
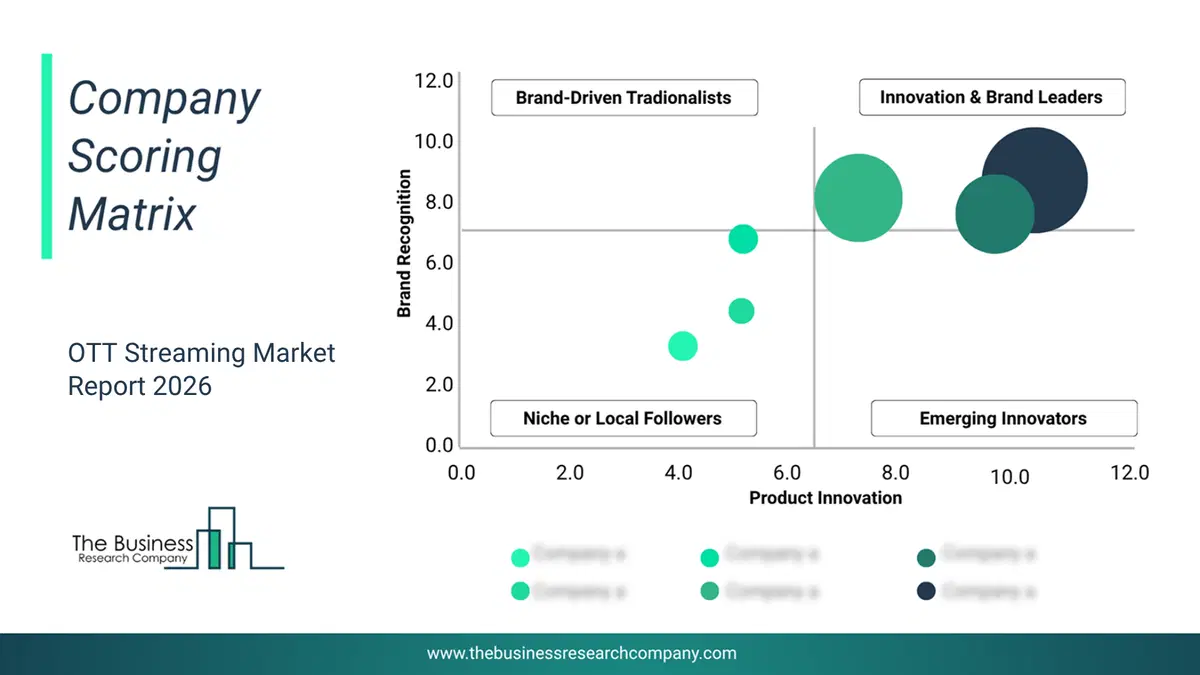
This chart maps companies by product innovation and brand strength, with bubble size indicating relative revenue, helping identify market leaders, challengers, and niche players. This is an illustrative chart; the full report provides a complete and accurate competitive analysis.
Global OTT Streaming Market Trends and Insights
Major companies operating in OTT streaming market are developing innovative technologies such as spatial audio drive the revenues in the market. Spatial audio is a technology that creates a surround sound effect using headphones or earbuds. It creates the illusion that sound is coming from all around the listener, even though it is only coming from two speakers. For instance, in February 2023, Netflix, a US-based OTT Streaming company, launched spatial audio across the streaming platform’s top 700 titles. This technology offers emulate immersive surround sound through stereo speakers or headphones across a range of devices including TVs, computers, tablets, and smartphones without requiring any specialist audio equipment thereby improving customer experience.What Are Latest Mergers And Acquisitions In The OTT Streaming Market?
In June 2024, Amazon.com Inc, a US-based multinational technology company focusing on e-commerce, cloud computing, digital streaming, and artificial intelligence, acquired MX Player for an undisclosed amount. Through this acquisition, Amazon aims to expand its ad-supported streaming offerings and strengthen its market position in India’s competitive digital entertainment landscape. MX Player is an India-based online streaming platform that has evolved from a video player to a major OTT service, offering diverse, ad-supported content and original programming tailored to Indian audiences.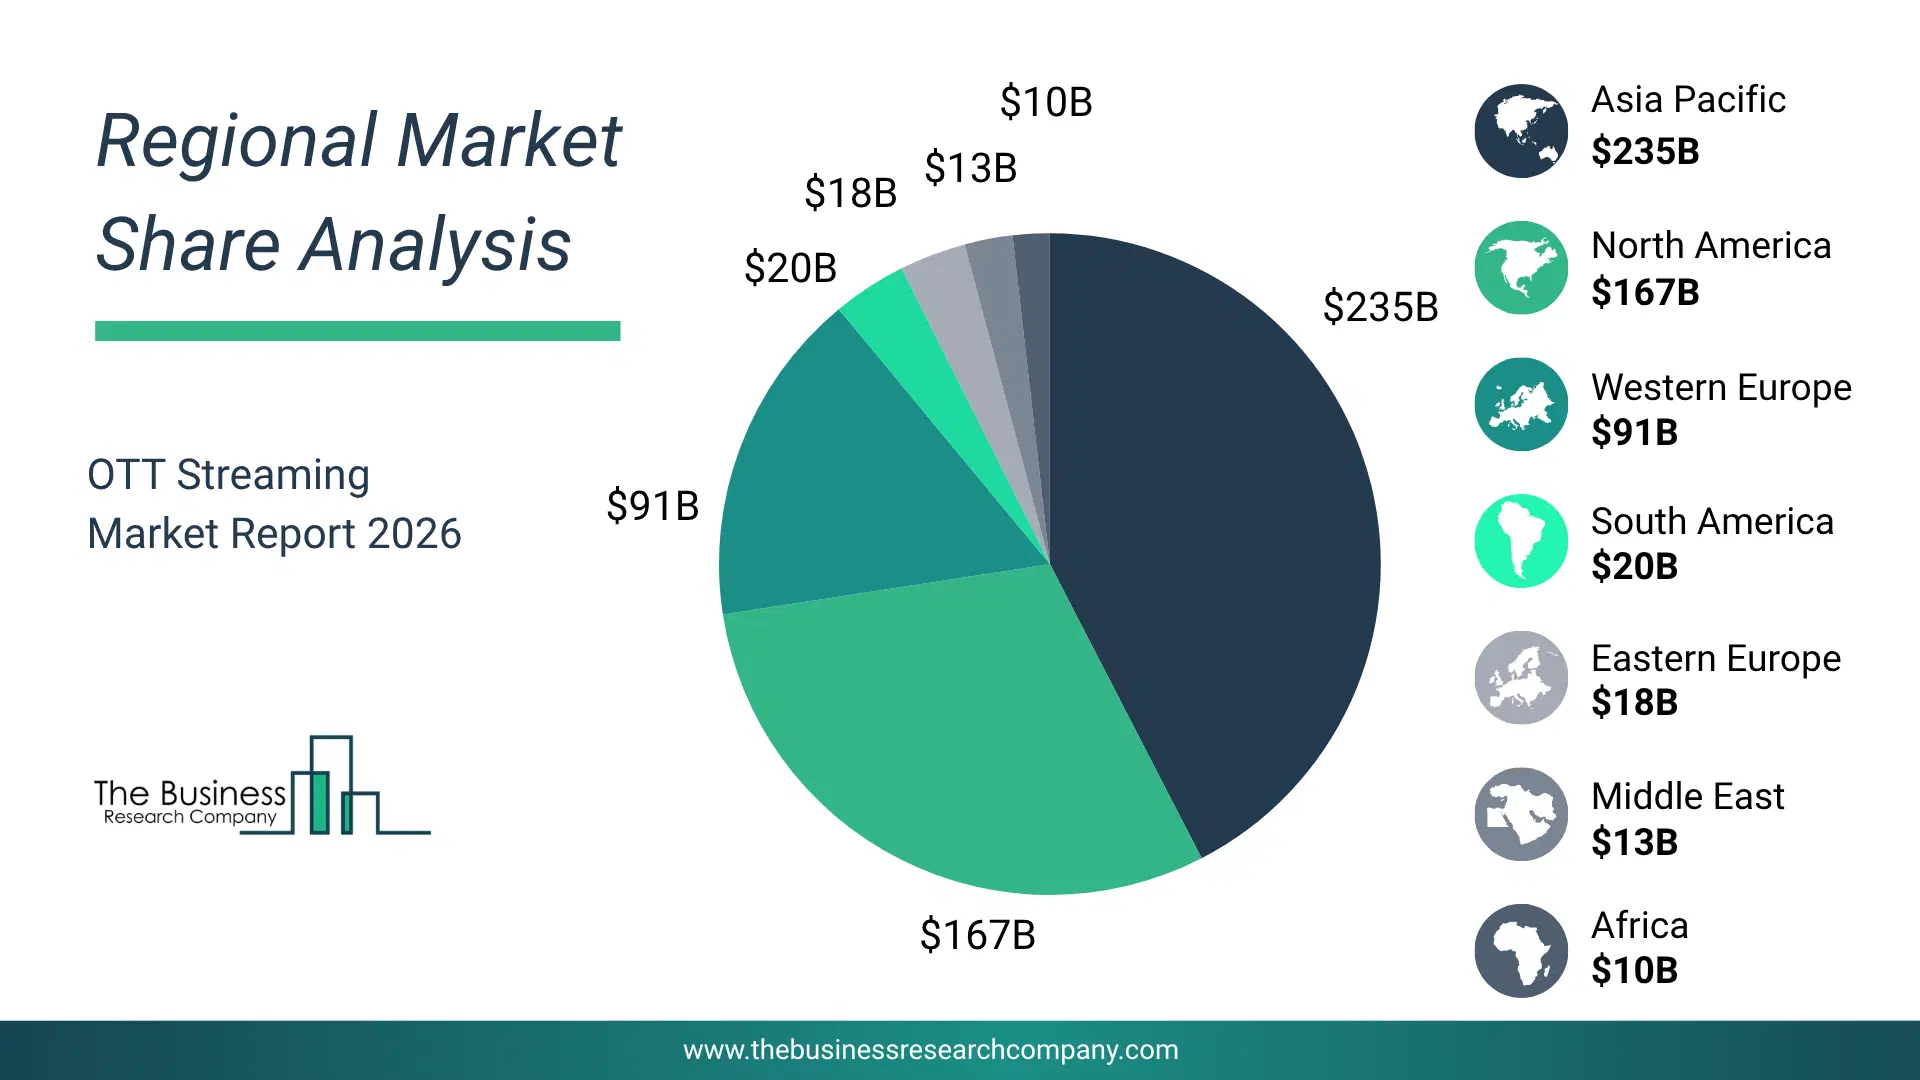
Regional Outlook
Asia-Pacific was the largest region in the OTT market in 2025. Middle East is expected to be the fastest-growing region in the global OTT streaming market share during the forecast period. The regions covered in this market report are Asia-Pacific, South East Asia, Western Europe, Eastern Europe, North America, South America, Middle East, Africa. The countries covered in this market report are Australia, Brazil, China, France, Germany, India, Indonesia, Japan, Taiwan, Russia, South Korea, UK, USA, Canada, Italy, Spain.What Defines the OTT Streaming Market?
The OTT streaming market includes revenues earned by entities by providing content/video streaming services through the internet. It includes the streaming services of T movies, sitcoms, dramas, reality shows, talk shows, game shows, news programs, children’s programs, art, sports programs, documentaries, animated cartoons, and instructional videos. Examples of well-known OTT players include Apple TV, iTunes, Netflix, Roku, Hulu, and Amazon among others. The market value includes the value of related goods sold by the service provider or included within the service offering. Only goods and services traded between entities or sold to end consumers are included.How is Market Value Defined and Measured?
The market value is defined as the revenues that enterprises gain from the sale of goods and/or services within the specified market and geography through sales, grants, or donations in terms of the currency (in USD unless otherwise specified). The revenues for a specified geography are consumption values that are revenues generated by organizations in the specified geography within the market, irrespective of where they are produced. It does not include revenues from resales along the supply chain, either further along the supply chain or as part of other products.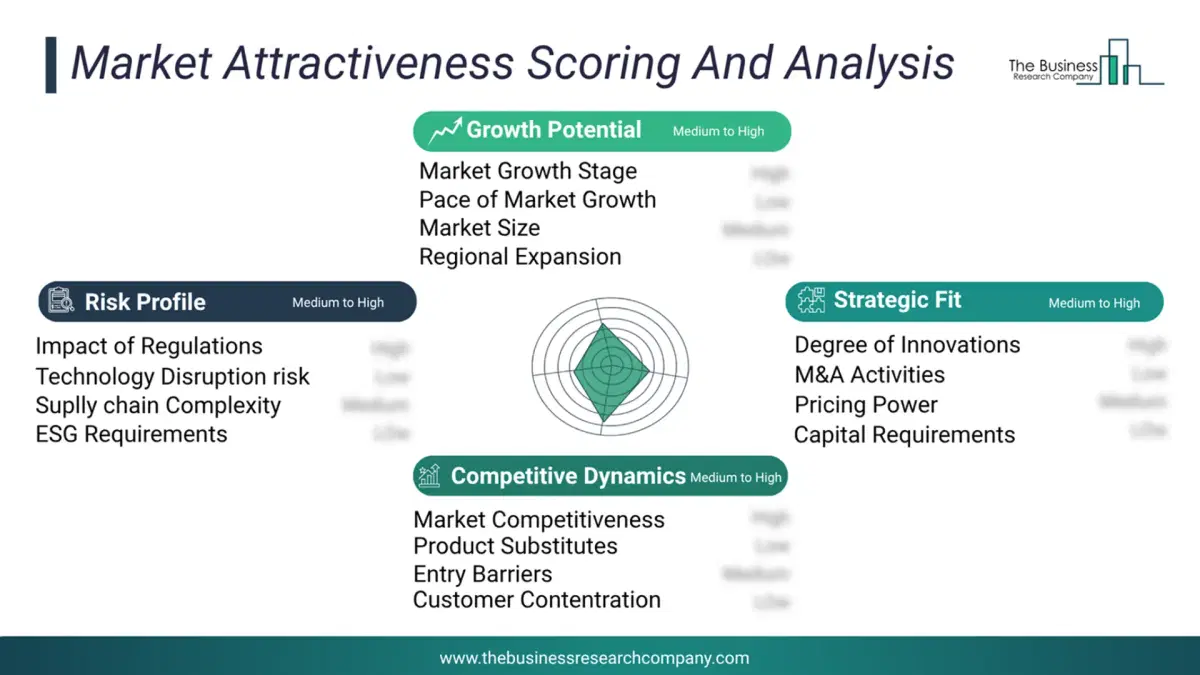
This chart presents market attractiveness based on a quantitative evaluation of growth, competition, strategic alignment, and risk, offering a clear view of opportunity areas for decision-making. This chart is for illustrative purposes; the full report contains the complete analysis.
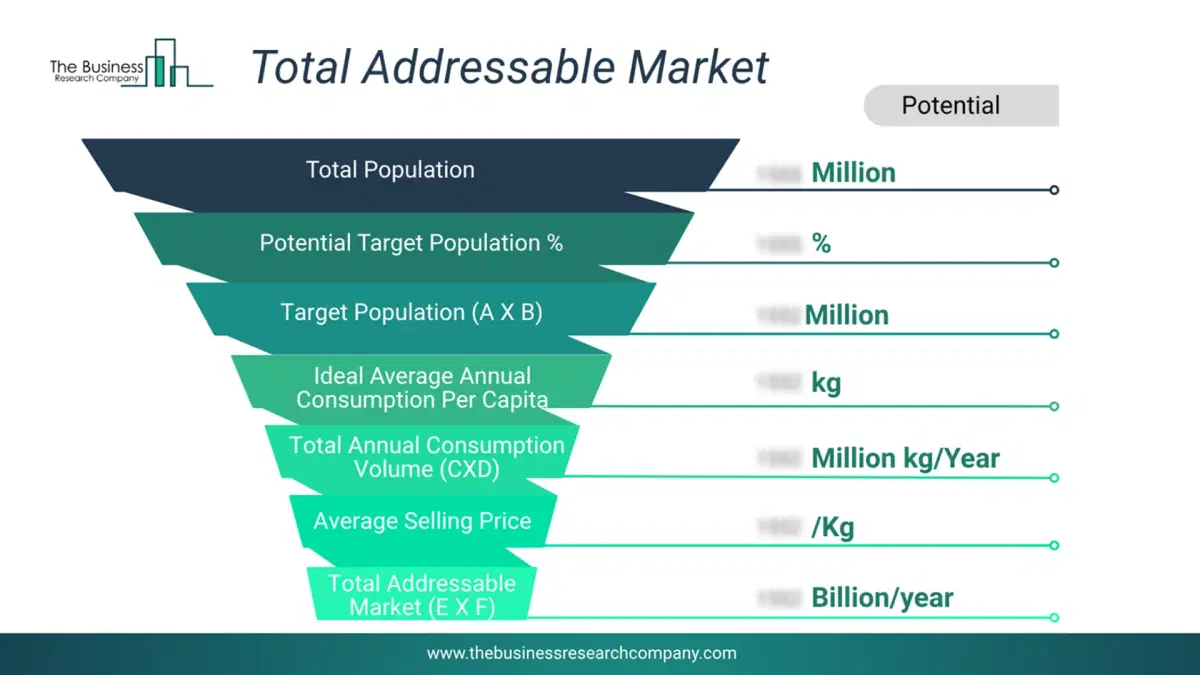
This chart highlights the Total Addressable Market (TAM) by estimating the maximum revenue opportunity using an assumption-driven approach, supporting strategic planning and opportunity sizing across markets. The chart is illustrative; the full report provides a more comprehensive analysis.
What Key Data and Analysis Are Included in the OTT Streaming Market Report 2026?
The ott streaming market research report is one of a series of new reports from The Business Research Company that provides market statistics, including industry global market size, regional shares, competitors with the market share, detailed market segments, market trends and opportunities, and any further data you may need to thrive in the ott streaming industry. The market research report delivers a complete perspective of everything you need, with an in-depth analysis of the current and future state of the industry.OTT Streaming Market Report Forecast Analysis
| Report Attribute | Details |
|---|---|
| Market Size Value In 2026 | $264.85 billion |
| Revenue Forecast In 2030 | $551.19 billion |
| Growth Rate | CAGR of 20.1% from 2026 to 2030 |
| Base Year For Estimation | 2025 |
| Actual Estimates/Historical Data | 2020-2025 |
| Forecast Period | 2026 - 2030 |
| Market Representation | Revenue in USD Billion and CAGR from 2026 to 2030 |
| Segments Covered | Device Type, Revenue Source, User Type, End User |
| Regional Scope | Asia-Pacific, Western Europe, Eastern Europe, North America, South America, Middle East, Africa |
| Country Scope | The countries covered in the report are Australia, Brazil, China, France, Germany, India, ... |
| Key Companies Profiled | Amazon.com Inc., Apple Inc., Alphabet Inc., Google LLC, Microsoft Corporation, AT&T Inc., The Walt Disney Company, Tencent Holdings Limited, Discovery Inc., Netflix Inc., Paramount Global, Disney DTC LLC, Sling TV LLC, ESPN Inc., Rakuten Inc., Telstra Corporation Limited, WarnerMedia LLC, Hulu LLC, Kakao Corporation, Lions Gate Entertainment Corp., Roku Inc., AMC Networks Inc., Peacock TV LLC, fuboTV Inc., ViacomCBS Pvt. Ltd., IndieFlix Group Inc., Philo Inc., Vudu Inc., BBC Studios and ITV plc, CuriosityStream Inc., Crunchyroll LLC, Funimation Global Group LLC, Kanopy Inc., MUBI Inc., Tubi Inc., Comcast Corporation, Zee Entertainment Enterprises Limited |
| Customization Scope | Request for Customization |
| Pricing And Purchase Options | Explore Purchase Options |