
Chained Consumer Food Service Market Report 2026
Global Outlook – By Type (Quick Service Restaurants, Fast Casual Restaurants, Full-Service Restaurants, Cafés And Coffee Shops, Buffets And Cafeterias), By Cuisine Type (American Cuisine, Italian Cuisine, Asian Cuisine, Mexican Cuisine, Health-Focused Cuisine), By Service Model (Dine-In Service, Takeout Service, Delivery Service, Drive-Thru Service, Online Ordering), By Channel (Online Ordering, Mobile Apps, In-Store), By End-User (Individual Consumers, Families, Corporate And Institutional Clients) – Market Size, Trends, Strategies, and Forecast to 2030
Chained Consumer Food Service Market Overview
• Chained Consumer Food Service market size has reached to $3155.27 billion in 2025 • Expected to grow to $4444.78 billion in 2030 at a compound annual growth rate (CAGR) of 7% • Growth Driver: Expanding Quick-Service Restaurant Formats Fueled Market Growth Due To Rising Consumer Preference For Convenience And Affordability • Market Trend: Robotic Automation Transforms Food Preparation In Quick-Service Restaurants • North America was the largest region in 2025 and Asia-Pacific is the fastest growing region.Market Gains By 2030 – Top Opportunities By Segment
Market Gain identifies the most promising market opportunities by highlighting the segments or products expected to generate the highest incremental revenue growth over the next five years.
What Is Covered Under Chained Consumer Food Service Market?
Chained consumer food service refers to a network of restaurants, cafés, or other food outlets operating under a common brand name and standardized business model across multiple locations. These chains ensure consistency in menu, service quality, and pricing through centralized management and supply chains. It helps to achieve scalability, brand recognition, and operational efficiency while delivering a uniform dining experience to consumers. The main types of chained consumer food service are quick service restaurants, fast casual restaurants, full-service restaurants, cafés and coffee shops, and buffets and cafeterias. Quick service restaurants (QSRs) refer to foodservice establishments that offer fast, convenient meals with limited table service, often emphasizing speed, affordability, and consistency. It includes different cuisine types such as American cuisine, Italian cuisine, Asian cuisine, Mexican cuisine, and health-focused cuisine, encompassing different service models such as dine-in service, takeout service, delivery service, drive-thru service, and online ordering. It is delivered through multiple channels, including online ordering platforms, mobile apps, and in-store, and caters to different end-users, such as individual consumers, families, and corporate and institutional clients.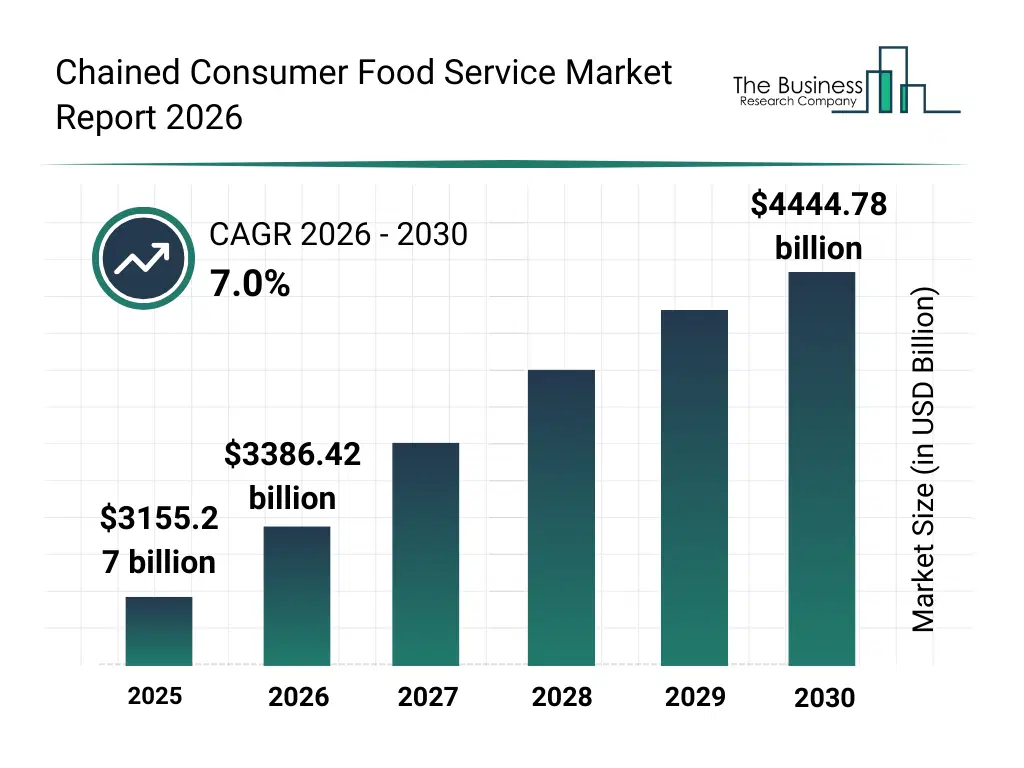
What Is The Chained Consumer Food Service Market Size and Share 2026?
The chained consumer food service market size has grown strongly in recent years. It will grow from $3155.27 billion in 2025 to $3386.42 billion in 2026 at a compound annual growth rate (CAGR) of 7.3%. The growth in the historic period can be attributed to growth of franchising business models, increasing urban consumer dining demand, expansion of mall and highway food outlets, development of standardized foodservice operations, rising brand-driven consumer preferences.What Is The Chained Consumer Food Service Market Growth Forecast?
The chained consumer food service market size is expected to see strong growth in the next few years. It will grow to $4444.78 billion in 2030 at a compound annual growth rate (CAGR) of 7.0%. The growth in the forecast period can be attributed to increasing investment in digital customer engagement, growing demand for omnichannel foodservice models, expansion into emerging urban markets, rising focus on sustainability in foodservice, increasing adoption of automation in kitchens. Major trends in the forecast period include increasing expansion of multi-location restaurant chains, rising adoption of centralized kitchen operations, growing focus on menu standardization and brand consistency, expansion of digital ordering and delivery channels, enhanced emphasis on operational efficiency.
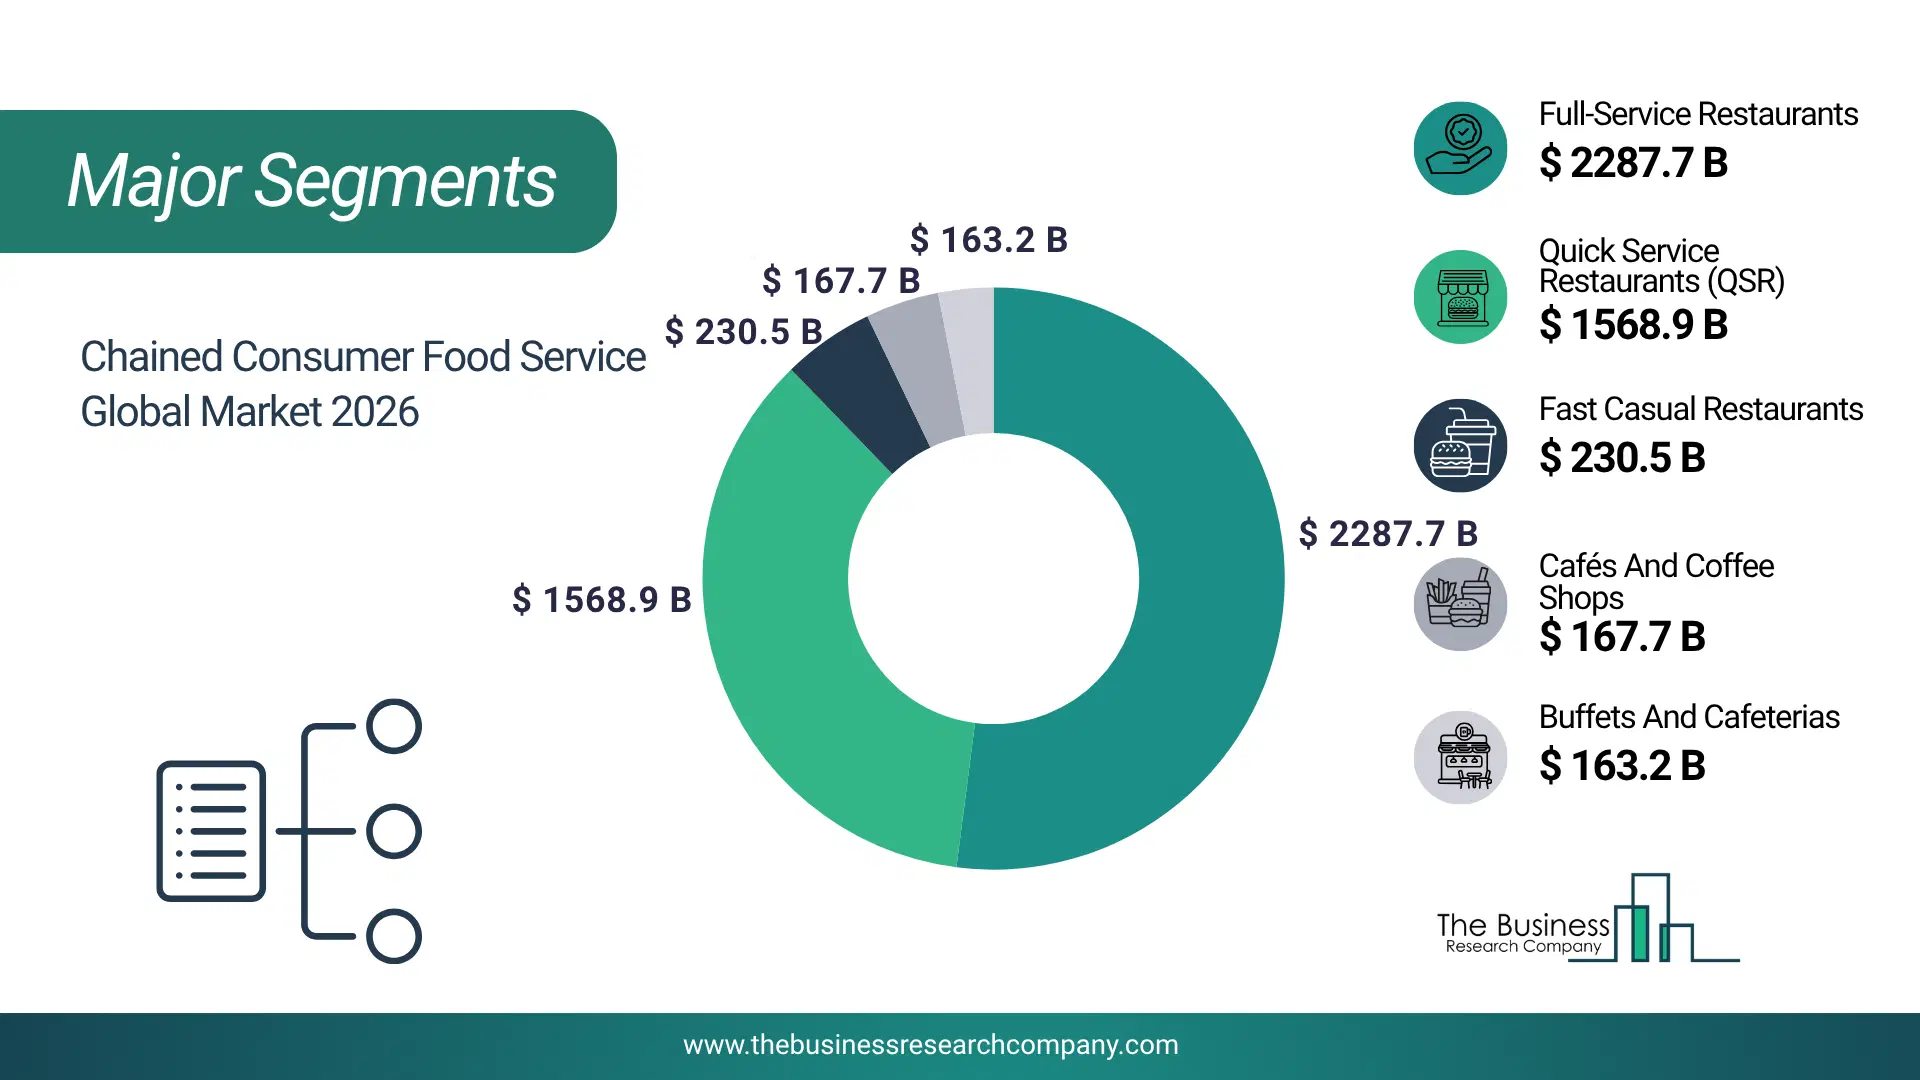
Global Chained Consumer Food Service Market Segmentation
1) By Type: Quick Service Restaurants, Fast Casual Restaurants, Full-Service Restaurants, Cafés And Coffee Shops, Buffets And Cafeterias 2) By Cuisine Type: American Cuisine, Italian Cuisine, Asian Cuisine, Mexican Cuisine, Health-Focused Cuisine 3) By Service Model: Dine-In Service, Takeout Service, Delivery Service, Drive-Thru Service, Online Ordering 4) By Channel: Online Ordering, Mobile Apps, In-Store 5) By End-User: Individual Consumers, Families, Corporate And Institutional Clients Subsegments: 1) By Quick Service Restaurants: Burgers And Sandwich Chains, Pizza Chains, Chicken Chains, Bakery And Confectionery Chains, Ice Cream And Frozen Dessert Chains 2) By Fast Casual Restaurants: Healthy Food Chains, Ethnic Cuisine Chains, Gourmet Burger Chains, Salad And Bowl Chains, Artisan Pizza Chains 3) By Full-Service Restaurants: Casual Dining Restaurants, Fine Dining Restaurants, Family Style Restaurants, Themed Restaurants, Contemporary Dining Restaurants 4) By Cafés And Coffee Shops: Specialty Coffee Chains, Bakery Cafés, Tea Cafés, Dessert Cafés, Juice And Smoothie Bars 5) By Buffets And Cafeterias: All-You-Can-Eat Buffets, Self-Service Cafeterias, Institutional Cafeterias, Hotel Buffets, Corporate Cafeterias The top segments in the chained consumer food service market will be: • Full-Service Restaurants will reach $2287.7 billion by 2030. • Quick Service Restaurants (QSR) will reach $1568.94 billion by 2030. • Fast Casual Restaurants will reach $230.49 billion by 2030. • Cafés And Coffee Shops will reach $167.68 billion by 2030. • Buffets And Cafeterias will reach $163.25 billion by 2030.What Is The Driver Of The Chained Consumer Food Service Market?
The expanding quick-service restaurant (QSR) formats fueled the growth of the chained consumer food service market during the historic period. Quick-service restaurant formats refer to limited-service dining establishments that provide fast meals, standardized menus, and efficient customer turnover. The expansion of quick-service restaurant (QSR) formats is largely driven by rising consumer demand for convenience, as busy lifestyles are pushing people to choose fast, affordable meal options that require minimal waiting time. The chained consumer food service helps quick-service restaurant (QSR) formats by introducing innovative drive-thru models, digital ordering systems, and compact store formats designed to serve customers efficiently in urban and suburban locations. For instance, in October 2025, according to Restroworks, a US-based restaurant technology solutions provider, in 2024, the quick service restaurant sector was valued at approximately $1.07 trillion, with around 52% of United States adults identified as frequent diners, particularly concentrated among young adults aged 18 to 34 (65%) and men (52%). Therefore, the expanding quick-service restaurant formats fueled the growth of the chained consumer food service industry.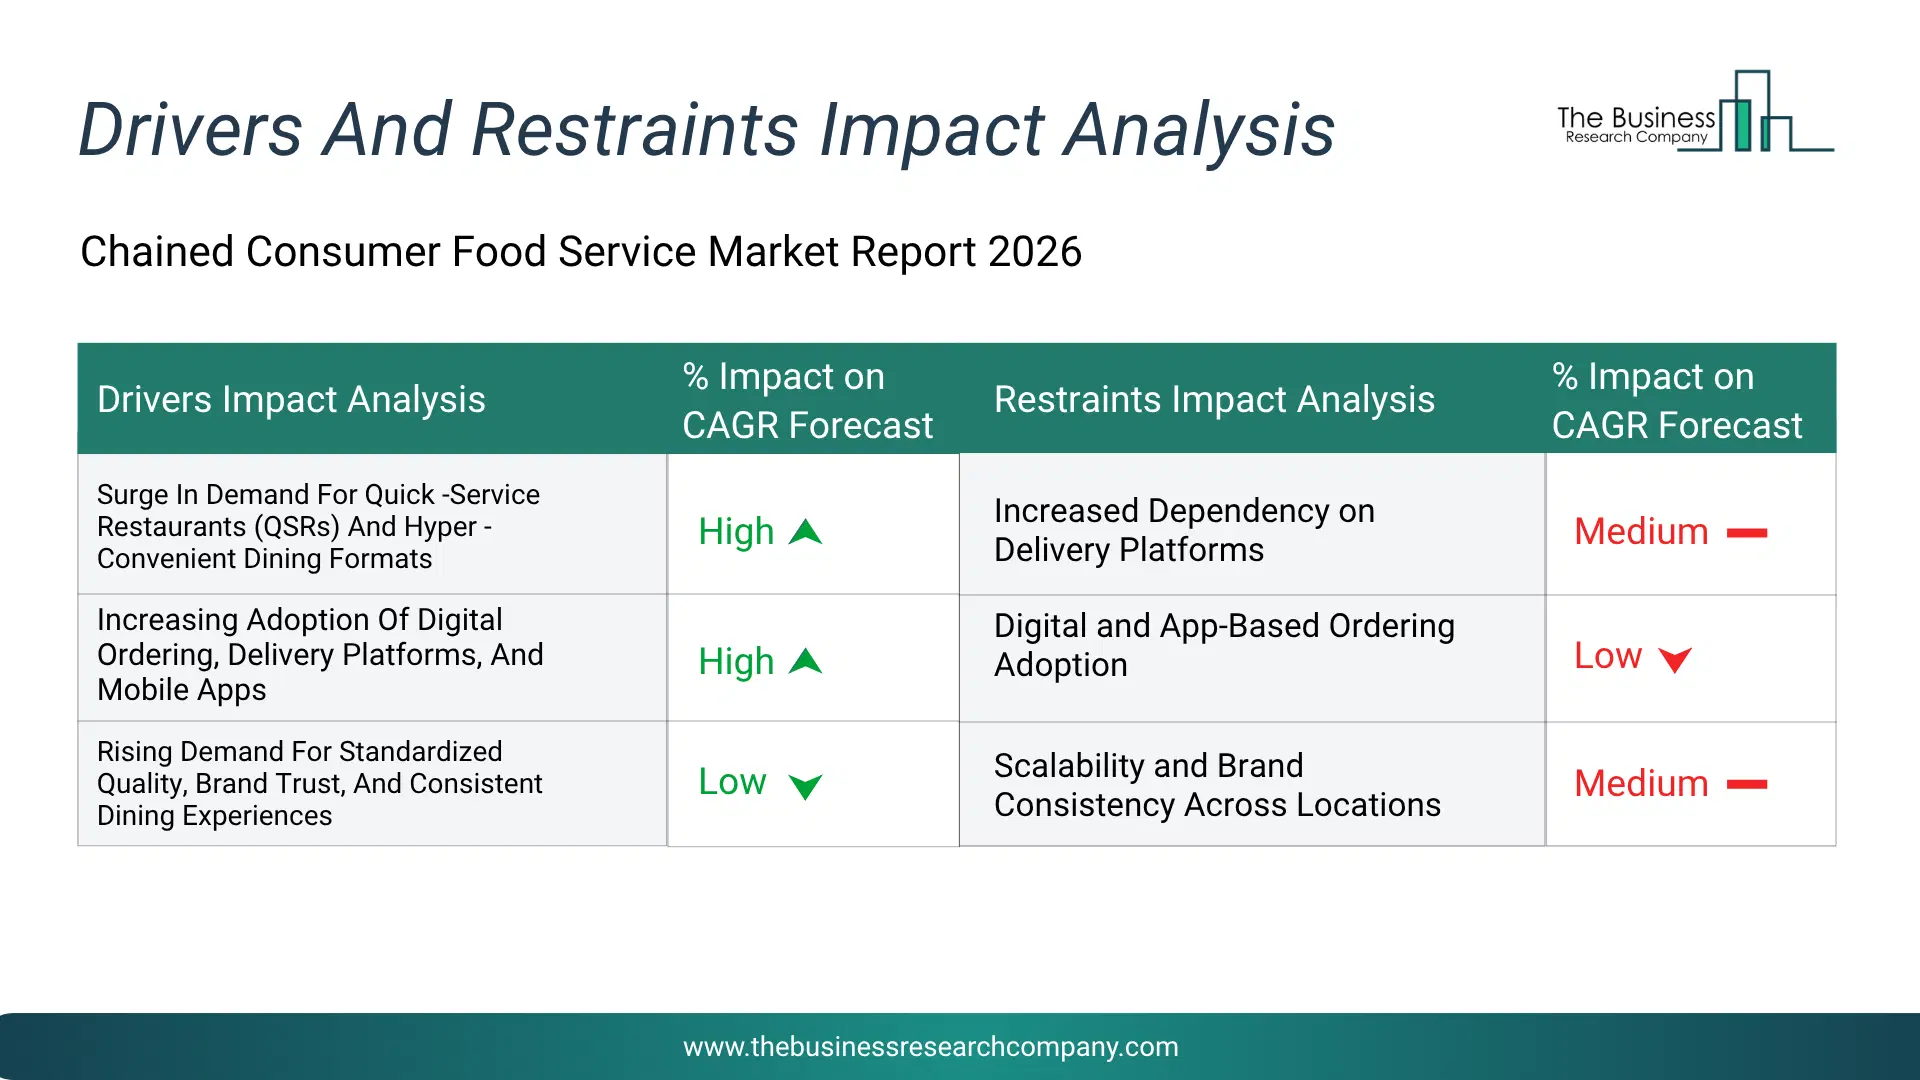
Infographic Chart Showing Key Market Drivers Analysis And Restraints For Chained Consumer Food Service Market
The chart presents an impact analysis of key drivers and restraints, quantifying their relative influence on the market's growth rate and helping assess the balance between growth enablers and limiting factors. This chart offers a high-level perspective; the full report contains more detailed insights.
How Will The Drivers Impact Growth In The Global Chained Consumer Food Service Market?
• Surge In Demand For Quick -Service Restaurants (QSRs) And Hyper -Convenient Dining Formats (High) – During the forecast period, the surge in demand for quick -service restaurants (qsrs) and hyper -convenient dining formats is expected to become a key growth driver for the chained consumer food service market by 2030. Consumers are increasingly prioritizing speed, affordability, and convenience in their dining choices, leading to strong growth of qsr chains offering standardized menus and fast service. The expansion of drive -thru outlets, takeaway options, and compact store formats is enabling brands to cater to time -constrained urban consumers. Additionally, menu innovation and value -based offerings are attracting a broader customer base across different income groups. This shift toward convenience -driven dining is reinforcing steady market expansion. • Increasing Adoption Of Digital Ordering, Delivery Platforms, And Mobile Apps (High) – During the forecast period, the increasing adoption of digital ordering, delivery platforms, and mobile apps is expected to emerge as a major factor driving the expansion of the chained consumer food service market by 2030. The integration of technology-enabled ordering systems, real-time tracking, and seamless payment solutions is enhancing customer experience and operational efficiency for food service providers. Partnerships with third-party delivery platforms and the growth of in-house delivery networks are expanding market reach and accessibility. Mobile apps and loyalty programs are further strengthening customer engagement and repeat purchases. • Rising Demand For Standardized Quality, Brand Trust, And Consistent Dining Experiences (Low) – During the forecast period, the rising demand for standardized quality, brand trust, and consistent dining experiences is expected to act as a key growth catalyst for the chained consumer food service market by 2030. Consumers increasingly prefer well-established chains that offer predictable quality, hygiene standards, and uniform service across locations. This trend is particularly strong among urban consumers and international travelers who value familiarity and reliability. Food service chains are investing in supply chain optimization, staff training, and quality control systems to maintain consistency. As brand loyalty strengthens, expansion of franchise models and multi-location presence is accelerating.How Will The Restraints Impact Growth In The Global Chained Consumer Food Service Market?
• Increased Dependency on Delivery Platforms (Medium) – During the forecast period, the increased dependency on delivery platforms acts as a restraint for the chained consumer food service market by significantly increasing operational costs through high commission fees and service charges. Heavy reliance on third-party platforms reduces direct customer engagement, limiting brand control and ownership of consumer data. Restaurants also face margin pressure as pricing flexibility decreases due to platform-driven discounts and promotions. Operational dependence on external platforms exposes businesses to service disruptions, policy changes, and algorithm-driven visibility risks. Over time, this dependency can weaken brand loyalty and profitability, constraining sustainable growth for food service chains. • Digital and App-Based Ordering Adoption (Low) – During the forecast period, the the rapid shift toward digital ordering platforms and mobile applications requires food service chains to continuously invest in technology infrastructure, software updates, and customer engagement tools. Smaller chains may struggle to keep pace with evolving consumer expectations and platform competition. The resulting technology and operational costs can create financial pressures and restrain profitability. • Scalability and Brand Consistency Across Locations (Medium) – During the forecast period, the scalability and brand consistency across locations can act as a restraint for the chained consumer food service market by limiting operational flexibility at the local level. As chains expand, maintaining uniform taste, service standards, and customer experience becomes increasingly complex across diverse regions. Strict standardization can restrict menu customization needed to match local preferences and cultural tastes. Rapid scaling also strains supply chains, training systems, and quality control mechanisms, increasing the risk of inconsistencies. Any deviation from brand expectations across outlets can damage brand reputation and reduce customer trust, ultimately constraining sustainable growth.Key Players In The Global Chained Consumer Food Service Market
Major companies operating in the chained consumer food service market are Starbucks Corporation, Compass Group PLC, Haidilao International Holding Ltd., Taco Bell, Aramark, The Cheesecake Factory, Darden Restaurants Inc., Brinker International Inc., Subway, Panera Bread Company Inc., Mixue Ice Cream & Tea, Wendy's Co., Restaurant Brands International Inc., KFC, Zensho Holdings Co. Ltd., McDonald's Corporation, Yum China Holdings Inc., Baskin-Robbins, Krispy Kreme, Pizza Hut, Domino's Pizza Inc., Chipotle Mexican Grill Inc., Dunkin' Brands Group Inc., Hunt Brothers Pizza, Luckin Coffee, Auntea Jenny, Cotti Coffee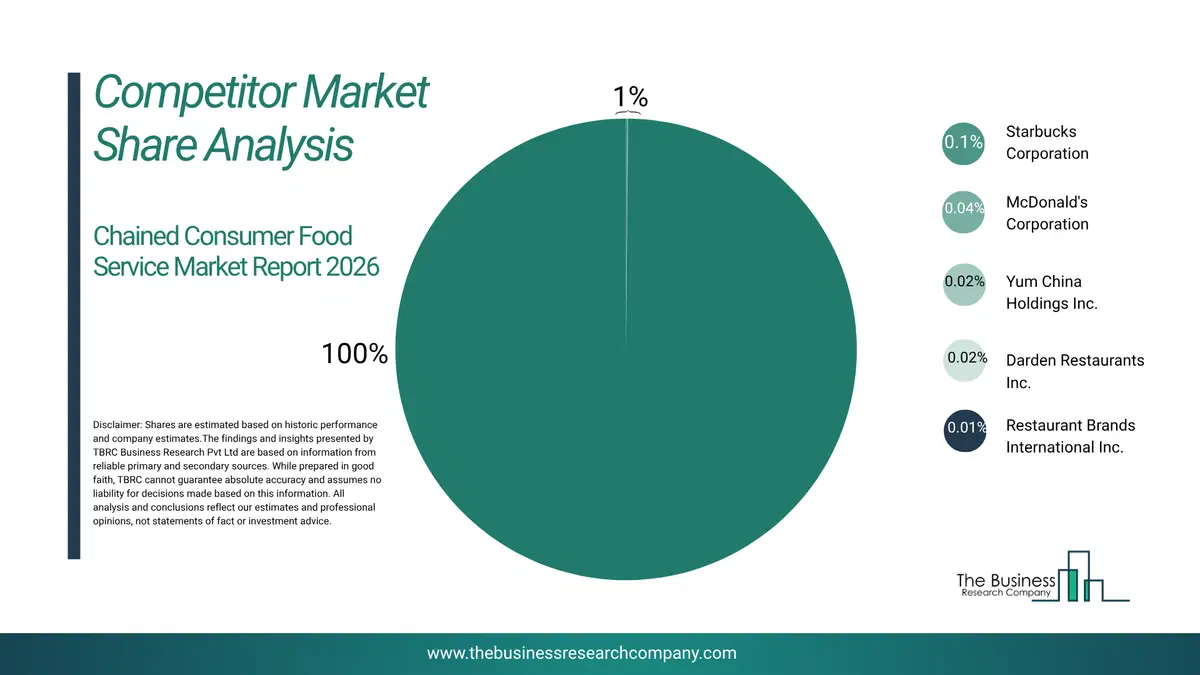
This chart is for illustrative purposes; the full report includes a detailed competitor analysis and comprehensive overview of the top 10 companies in the market.
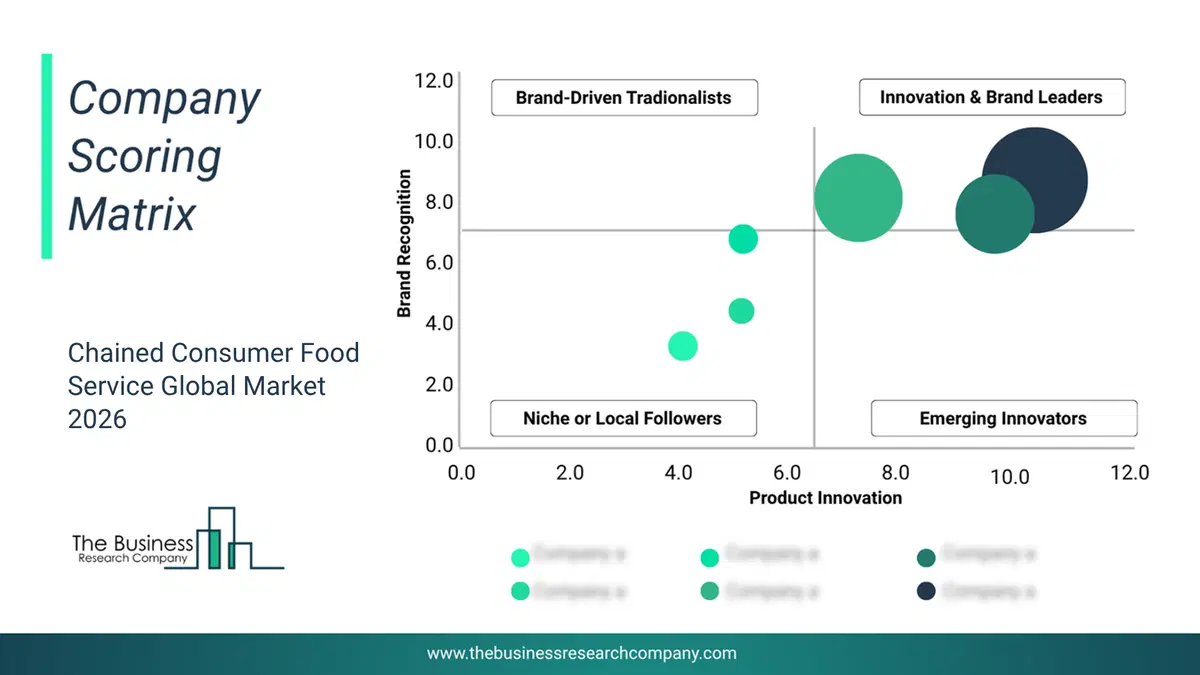
This chart maps companies by product innovation and brand strength, with bubble size indicating relative revenue, helping identify market leaders, challengers, and niche players. This is an illustrative chart; the full report provides a complete and accurate competitive analysis.
Global Chained Consumer Food Service Market Trends and Insights
Major companies operating in the chained consumer food service market are focusing on developing innovative solutions, such as automation solutions, to improve operational efficiency, reduce labour dependency, and ensure consistent product quality. Automation solutions refer to advanced robotic and digital kitchen systems that streamline food preparation, assembly, and delivery processes to enhance speed and accuracy while optimizing labour costs. For instance, in June 2023, Sweetgreen, a US-based fast-casual salad chain, introduced its Infinite Kitchen automated restaurant concept in Naperville, Illinois. The system features robotic dispensing of ingredients along a conveyor-style assembly line, automated portion control for consistent servings, and data-driven order customization to minimize waste and enhance throughput. This innovation represents a transformative step in the evolution of restaurant operations by standardizing food preparation, improving order accuracy, and creating a scalable automation framework for future restaurant expansions, ultimately redefining efficiency, and customer experience in the chained consumer food service sector.What Are Latest Mergers And Acquisitions In The Chained Consumer Food Service Market?
In May 2024, Restaurant Brands International (RBI), a Canada-based quick-service restaurant company, acquired Carrols Restaurant Group for approximately US$1.0 billion. With this acquisition, RBI aimed to gain direct control of Carrols’ large Burger King/Popeyes franchise portfolio in the U.S., accelerate remodels and system efficiencies, and strengthen its operational scale. Carrols Restaurant Group is a US-based restaurant franchisee specialising in chained consumer food services.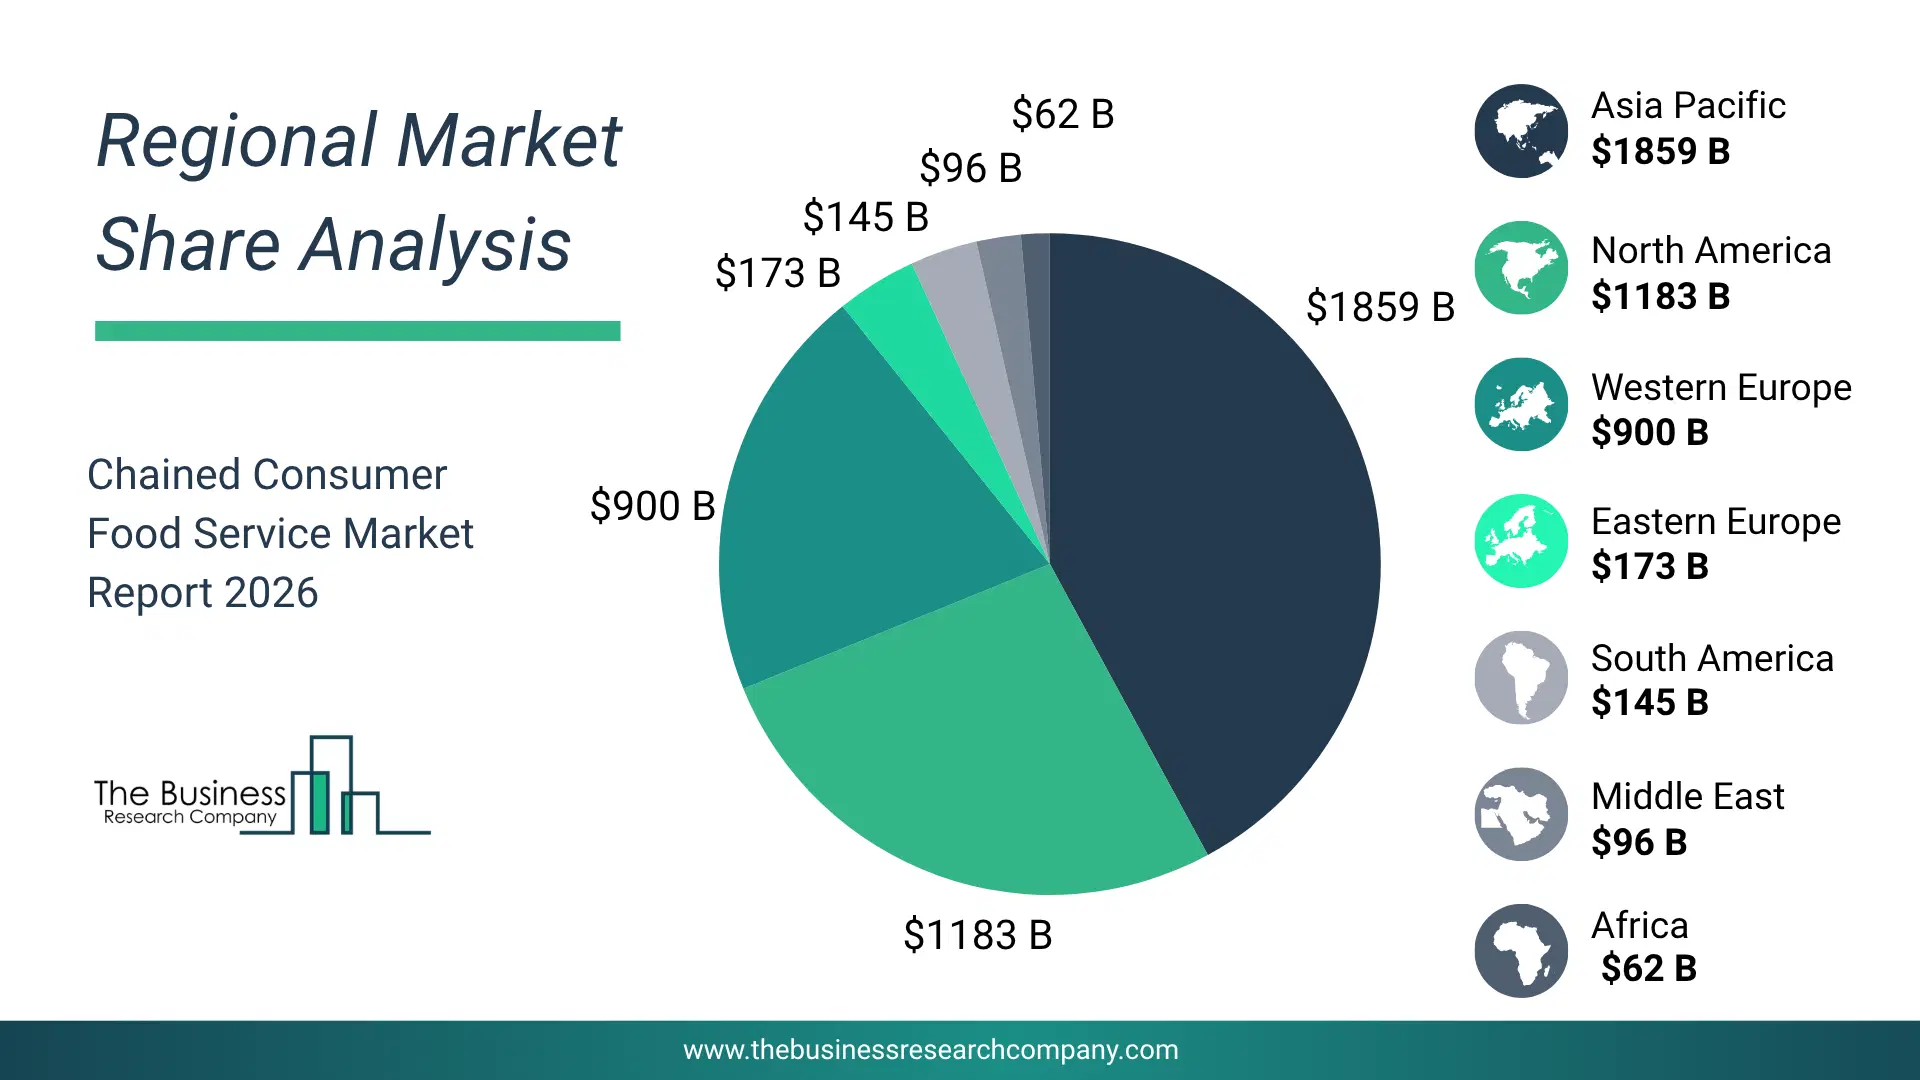
Regional Outlook
North America was the largest region in the chained consumer food service market in 2025. Asia-Pacific is expected to be the fastest-growing region in the forecast period. The regions covered in this market report are Asia-Pacific, South East Asia, Western Europe, Eastern Europe, North America, South America, Middle East and Africa. The countries covered in this market report are Australia, Brazil, China, France, Germany, India, Indonesia, Japan, Taiwan, Russia, South Korea, UK, USA, Italy, Spain, CanadaWhat Defines the Chained Consumer Food Service Market?
The chained consumer food service market includes revenues earned by entities through the menu customization services, loyalty program management, digital marketing, franchise management, and customer relationship management. These entities provide services such as food preparation, dine-in and takeaway dining, beverage service, and digital ordering platforms. The market value includes the value of related goods sold by the service provider, such as branded merchandise and packaged food products. Only goods and services traded between entities or sold to end consumers are included.How is Market Value Defined and Measured?
The market value is defined as the revenues that enterprises gain from the sale of goods and/or services within the specified market and geography through sales, grants, or donations in terms of the currency (in USD unless otherwise specified). The revenues for a specified geography are consumption values that are revenues generated by organizations in the specified geography within the market, irrespective of where they are produced. It does not include revenues from resales along the supply chain, either further along the supply chain or as part of other products.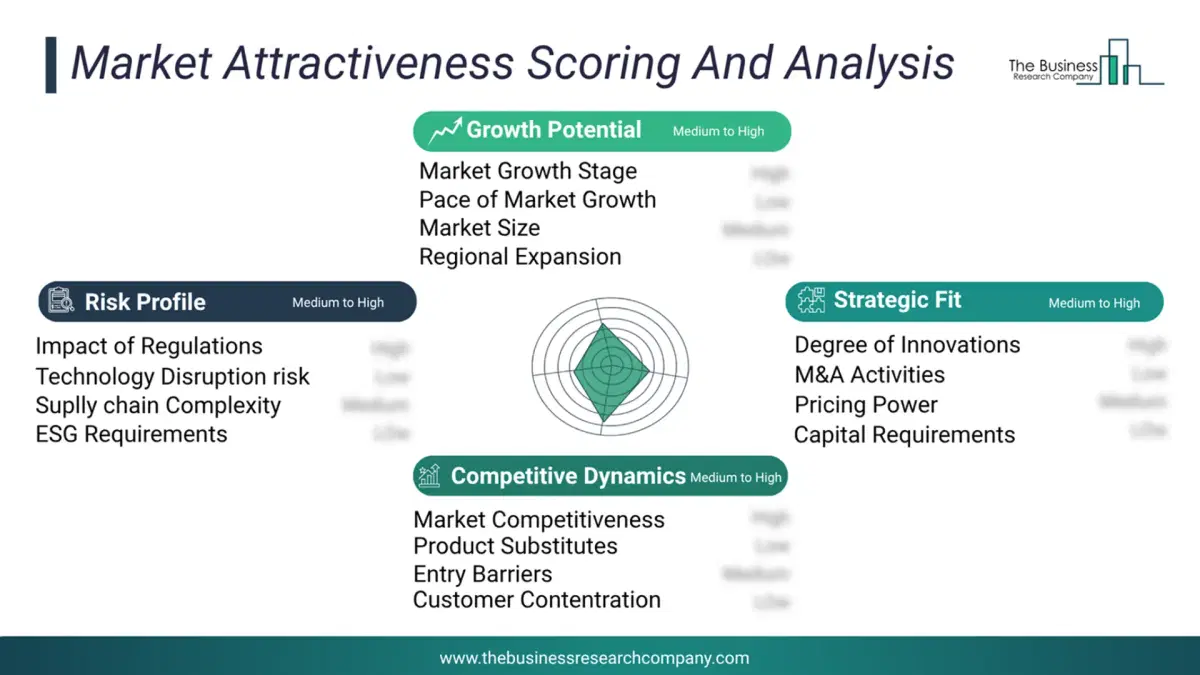
This chart presents market attractiveness based on a quantitative evaluation of growth, competition, strategic alignment, and risk, offering a clear view of opportunity areas for decision-making. This chart is for illustrative purposes; the full report contains the complete analysis.
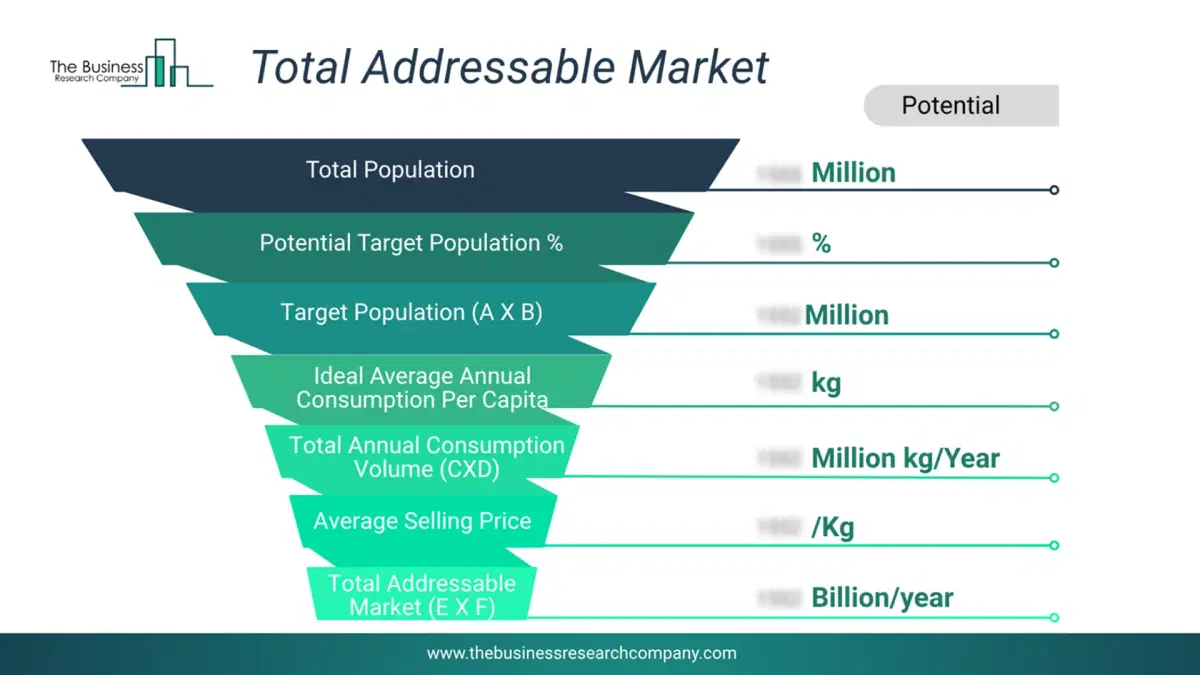
This chart highlights the Total Addressable Market (TAM) by estimating the maximum revenue opportunity using an assumption-driven approach, supporting strategic planning and opportunity sizing across markets. The chart is illustrative; the full report provides a more comprehensive analysis.
What Key Data and Analysis Are Included in the Chained Consumer Food Service Market Report 2026?
The chained consumer food service market research report is one of a series of new reports from The Business Research Company that provides market statistics, including industry global market size, regional shares, competitors with the market share, detailed market segments, market trends and opportunities, and any further data you may need to thrive in the chained consumer food service industry. The market research report delivers a complete perspective of everything you need, with an in-depth analysis of the current and future state of the industry.Chained Consumer Food Service Market Report Forecast Analysis
| Report Attribute | Details |
|---|---|
| Market Size Value In 2026 | $3386.42 billion |
| Revenue Forecast In 2030 | $4444.78 billion |
| Growth Rate | CAGR of 7.3% from 2026 to 2030 |
| Base Year For Estimation | 2025 |
| Actual Estimates/Historical Data | 2020-2025 |
| Forecast Period | 2026 - 2030 |
| Market Representation | Revenue in USD Billion and CAGR from 2026 to 2030 |
| Segments Covered | Type, Cuisine Type, Service Model, Channel, End-User |
| Regional Scope | Asia-Pacific, Western Europe, Eastern Europe, North America, South America, Middle East, Africa |
| Country Scope | The countries covered in the report are Australia, Brazil, China, France, Germany, India, Indonesia, Japan, Taiwan, Russia, South Korea, UK, USA, Canada, Italy, Spain. |
| Key Companies Profiled | Starbucks Corporation, Compass Group PLC, Haidilao International Holding Ltd., Taco Bell, Aramark, The Cheesecake Factory, Darden Restaurants Inc., Brinker International Inc., Subway, Panera Bread Company Inc., Mixue Ice Cream & Tea, Wendy's Co., Restaurant Brands International Inc., KFC, Zensho Holdings Co. Ltd., McDonald's Corporation, Yum China Holdings Inc., Baskin-Robbins, Krispy Kreme, Pizza Hut, Domino's Pizza Inc., Chipotle Mexican Grill Inc., Dunkin' Brands Group Inc., Hunt Brothers Pizza, Luckin Coffee, Auntea Jenny, Cotti Coffee |
| Customization Scope | Request for Customization |
| Pricing And Purchase Options | Explore Purchase Options |