
Energy And Utilities Construction Market Report 2026
Global Outlook – By Type (Energy Construction, Utilities Infrastructure Construction), By Technology (Conventional Technologies, Renewable Energy Technologies), By Scale of Project (Small-Scale Projects, Medium-Scale Projects, Large-Scale Projects), By Application (Civil Use, Military Use), By End-Users (Residential, Commercial And Industrial, Public Sector And Infrastructure) – Market Size, Trends, Strategies, and Forecast to 2030
Energy And Utilities Construction Market Overview
• Energy And Utilities Construction market size has reached to $139.64 billion in 2025 • Expected to grow to $208.73 billion in 2030 at a compound annual growth rate (CAGR) of 8.3% • Growth Driver: Increasing Demand For Sustainable And Clean Energy Alternatives Fueling The Growth Of The Market Due To Rising Depletion Of Fossil Fuels • Market Trend: Next-Generation Energy Infrastructure Transforming Utilities • North America was the largest region in 2025.Market Gains By 2030 – Top Opportunities By Segment
Market Gain identifies the most promising market opportunities by highlighting the segments or products expected to generate the highest incremental revenue growth over the next five years.
What Is Covered Under Energy And Utilities Construction Market?
Energy and utilities construction refers to developing and building infrastructure that supports the generation, transmission, and distribution of essential services such as electricity, water, gas, sewage, and telecommunications. These constructions are vital for ensuring the reliable and efficient delivery of energy and utility services to residential, commercial, and industrial users, and they often incorporate traditional and renewable energy sources to support sustainability and economic growth. The main types of energy and utilities construction include energy construction and utilities infrastructure construction. Energy construction involves building infrastructure that generates and supplies energy, such as power plants, refineries, and transmission lines. The technologies used in this sector comprise conventional technologies, renewable energy technologies, smart grid technologies, and advanced metering infrastructure, which are implemented across different project scales, including small-scale, medium-scale, and large-scale projects, depending on the scope and capacity of the infrastructure, with applications spanning both civil use and military use. End-users of this construction segment include residential, commercial and industrial sectors, as well as the public sector and infrastructure.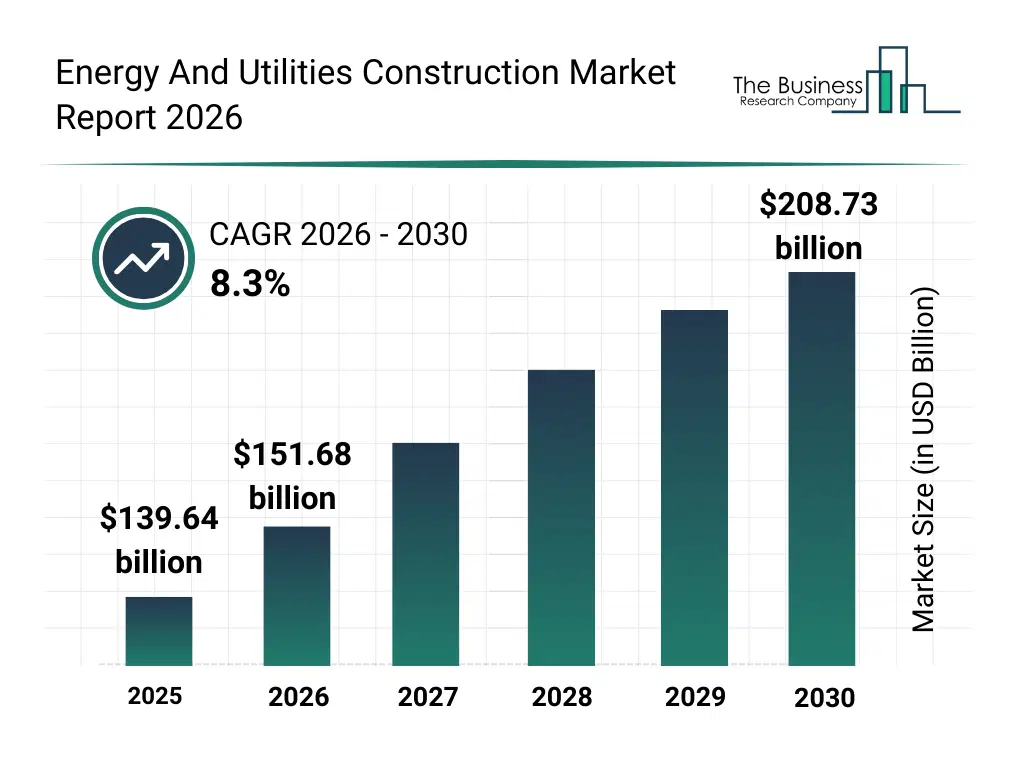
What Is The Energy And Utilities Construction Market Size and Share 2026?
The energy and utilities construction market size has grown strongly in recent years. It will grow from $139.64 billion in 2025 to $151.68 billion in 2026 at a compound annual growth rate (CAGR) of 8.6%. The growth in the historic period can be attributed to urbanization growth, expansion of power generation capacity, government infrastructure spending, aging utility replacement needs, industrial energy demand.What Is The Energy And Utilities Construction Market Growth Forecast?
The energy and utilities construction market size is expected to see strong growth in the next few years. It will grow to $208.73 billion in 2030 at a compound annual growth rate (CAGR) of 8.3%. The growth in the forecast period can be attributed to renewable energy transition, grid digitization initiatives, electric vehicle charging infrastructure expansion, public private infrastructure investments, climate resilience projects. Major trends in the forecast period include expansion of renewable energy infrastructure, growth in smart grid development, rising investment in utility modernization, increase in large scale infrastructure projects, adoption of advanced metering systems.
Global Energy And Utilities Construction Market Segmentation
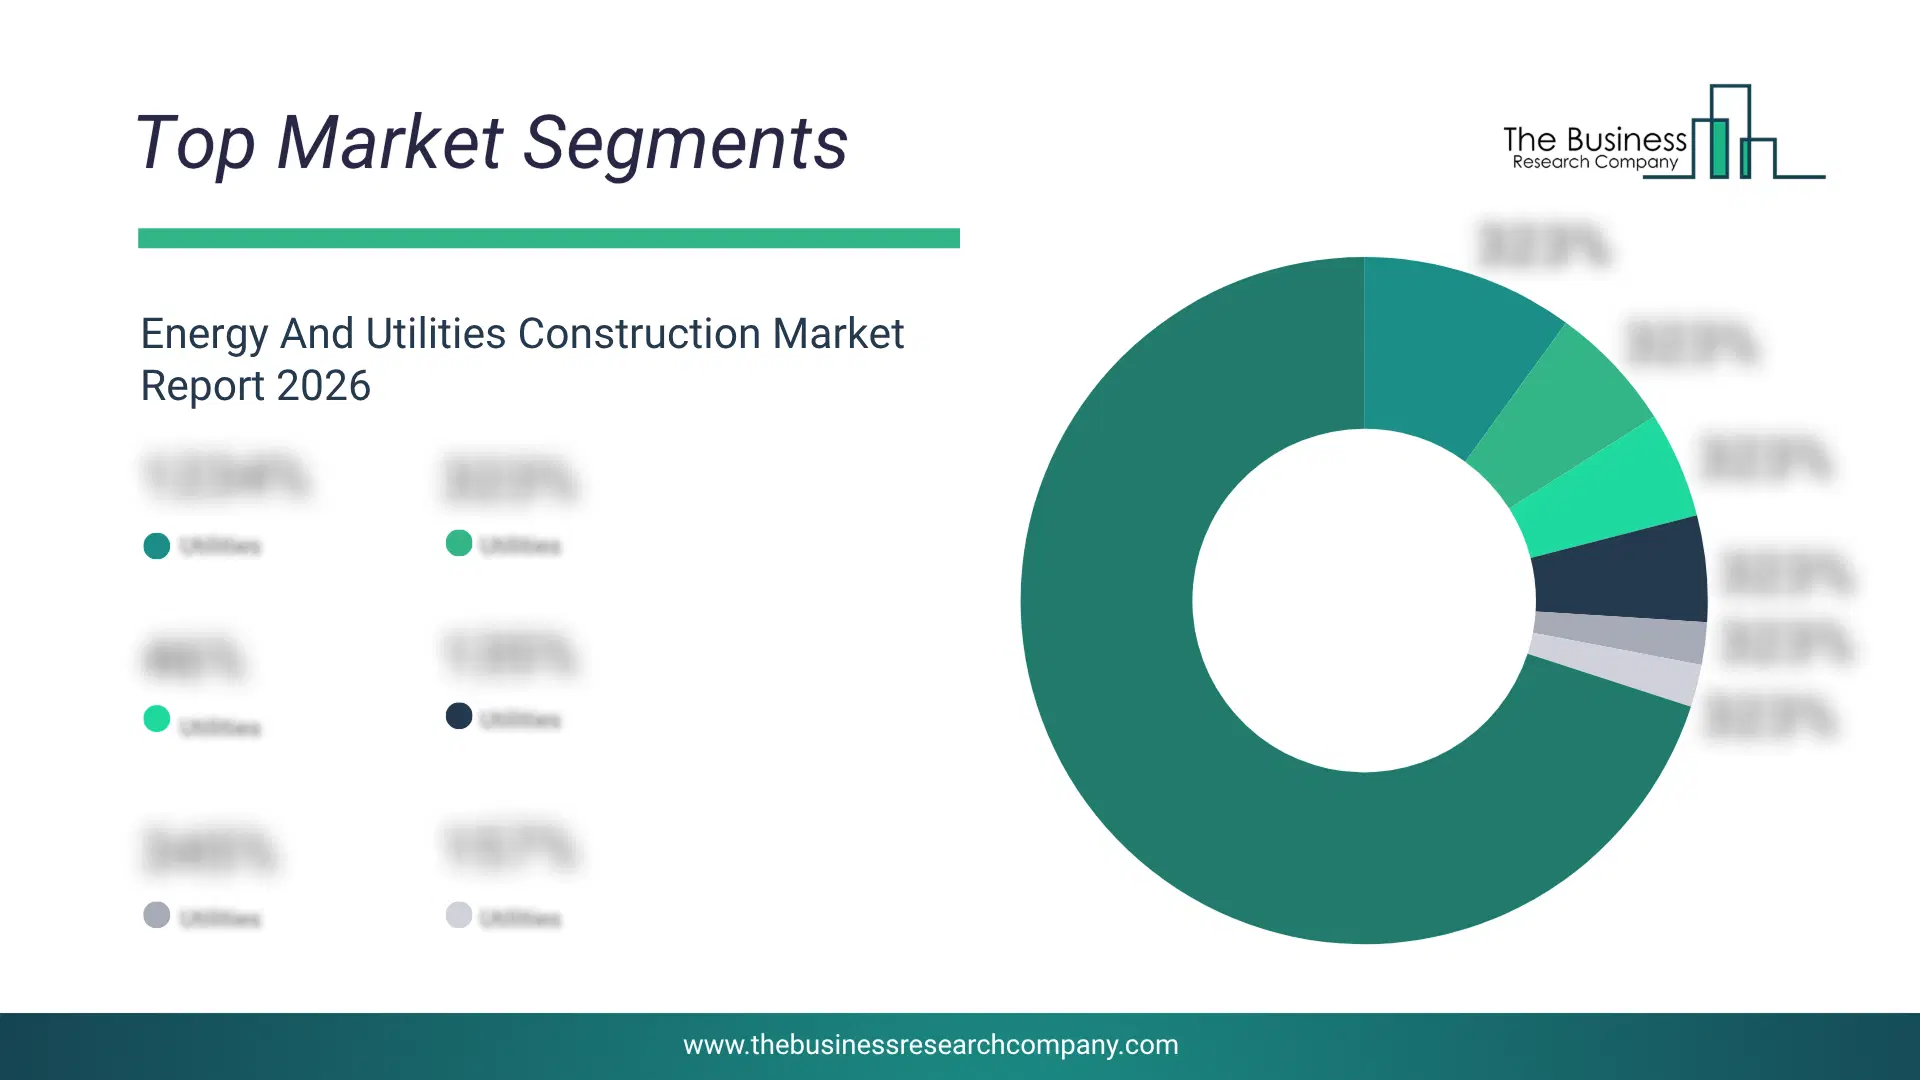
1) By Type: Energy Construction, Utilities Infrastructure Construction 2) By Technology: Conventional Technologies, Renewable Energy Technologies 3) By Scale of Project: Small-Scale Projects, Medium-Scale Projects, Large-Scale Projects 4) By Application: Civil Use, Military Use 5) By End-Users: Residential, Commercial And Industrial, Public Sector And Infrastructure Subsegments: 1) By Energy Construction: Power Plant Construction, Renewable Energy Facility Construction, Transmission Line Construction, Electrical Substation Construction, Battery Energy Storage System Installation, Microgrid Development, Electric Vehicle Charging Infrastructure 2) By Utilities Infrastructure Construction: Water Supply Network Construction, Sewage and Wastewater System Construction, Natural Gas Pipeline Construction, Electrical Grid Infrastructure, District Heating and Cooling Systems, Telecommunications Utility Lines, Stormwater Drainage Systems The top segments in the energy and utilities construction market will be: • Energy Construction will reach $117.7 Billion by 2030. • Utilities Infrastructure Construction will reach $89.03 Billion by 2030.What Is The Driver Of The Energy And Utilities Construction Market?
The increasing demand for sustainable and clean energy alternatives is expected to propel the growth of the energy and utilities construction market going forward. Sustainable and clean energy alternatives are environmentally friendly energy sources that rely on natural processes and generate little to no harmful emissions. The demand for sustainable and clean energy alternatives is rising due to the depletion of fossil fuel reserves, as there is a stronger push to adopt long-term, renewable solutions. Energy and utility construction helps advance sustainable and clean energy alternatives by building and upgrading facilities that efficiently use renewable energy sources. For instance, in January 2024, according to the International Energy Agency (IEA), a France-based intergovernmental organization, in 2023, the global renewable energy capacity increased by 50% in 2023 compared to 2022, reaching nearly 510 gigawatts (GW), with solar PV making up about 75% of the new additions. Therefore, the increasing demand for sustainable and clean energy alternatives is driving the growth of the energy and utilities construction industry.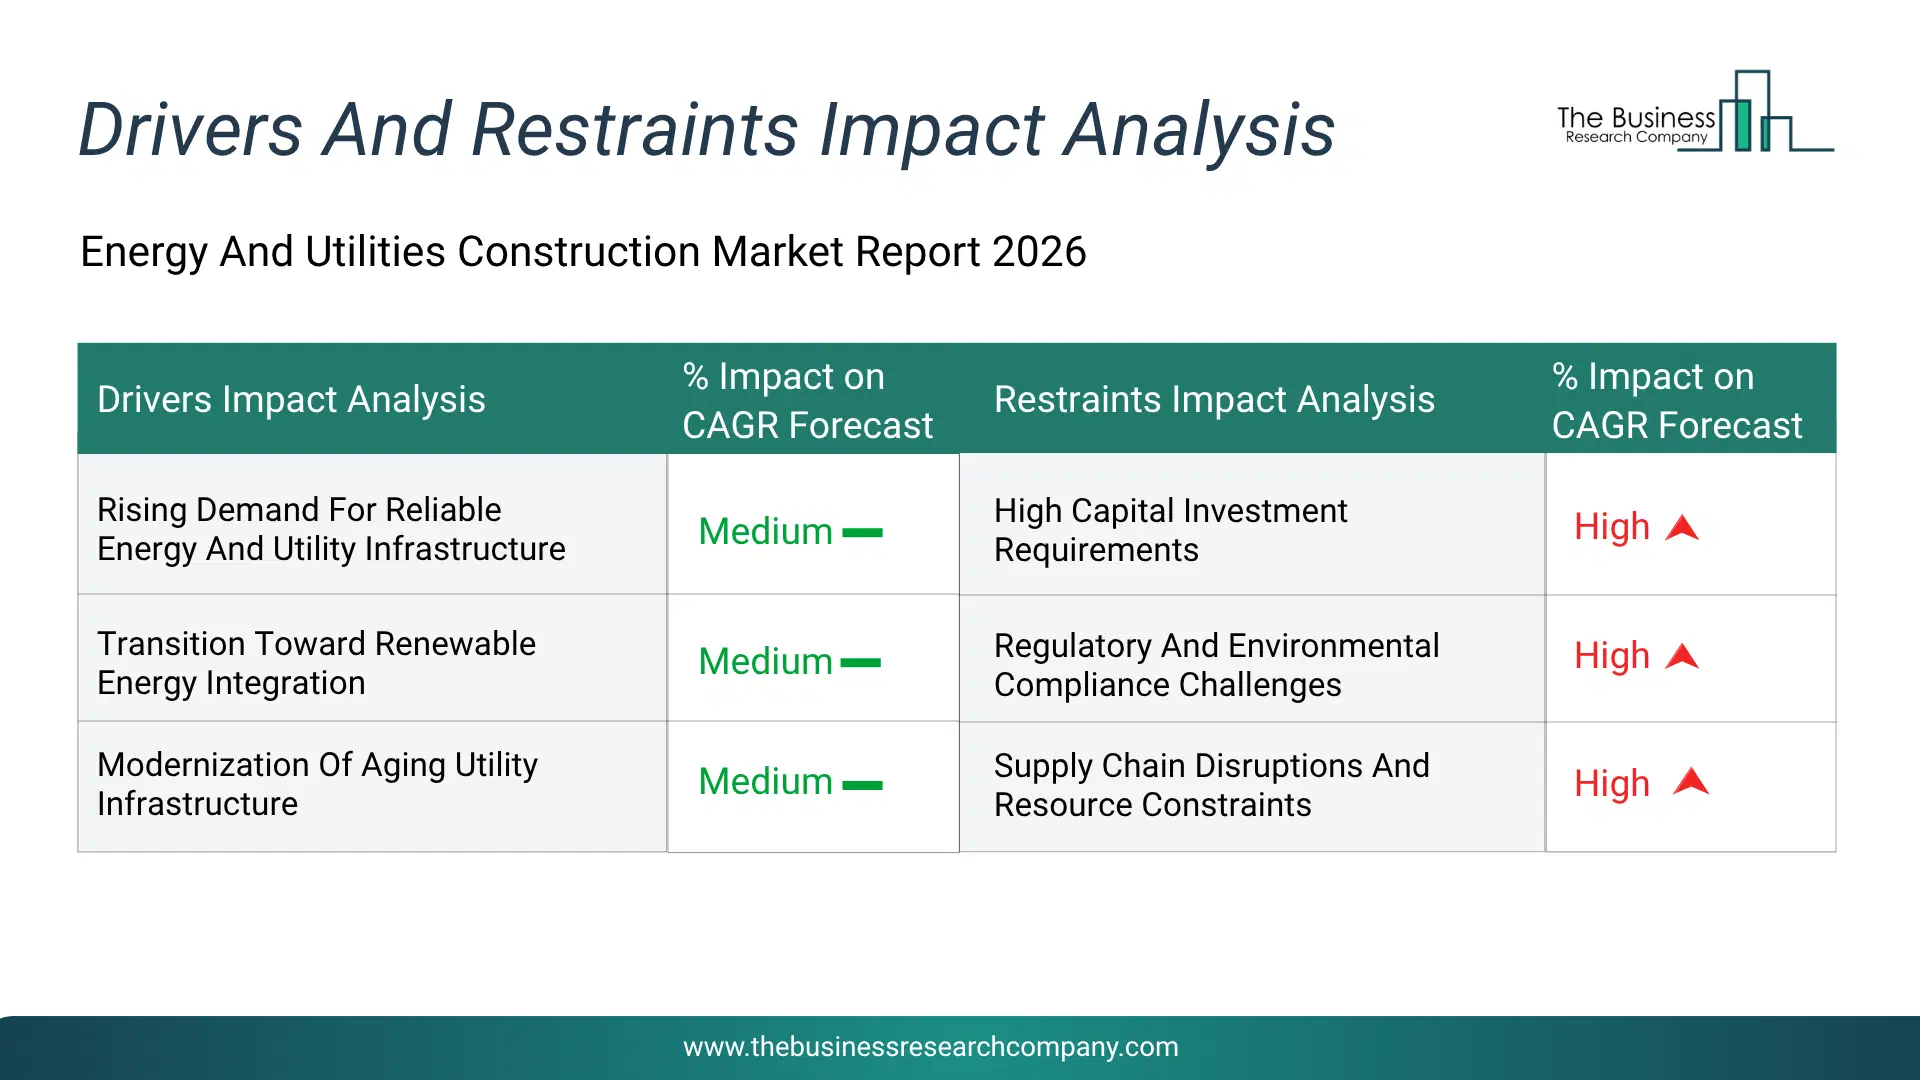
Infographic Chart Showing Key Market Drivers Analysis And Restraints For Energy And Utilities Construction Market
The chart presents an impact analysis of key drivers and restraints, quantifying their relative influence on the market's growth rate and helping assess the balance between growth enablers and limiting factors. This chart offers a high-level perspective; the full report contains more detailed insights.
How Will The Drivers Impact Growth In The Global Energy And Utilities Construction Market?
• Rising Demand For Reliable Energy And Utility Infrastructure (Medium) – During the forecast period, the rising demand for reliable energy and utility infrastructure is expected to become a key growth driver for the energy and utilities construction market by 2030. The increasing demand for uninterrupted electricity, water supply, and waste management services is accelerating infrastructure development. Rapid urbanization and industrialization are placing pressure on existing systems, requiring expansion and new construction projects. Governments are investing in strengthening grids and utility networks to ensure service reliability. Electrification trends across transport and industry are further boosting infrastructure needs. Developing regions are also focusing on building foundational systems to support economic growth. This growing demand directly contributes to higher construction activity and revenue generation. • Transition Toward Renewable Energy Integration (Medium) – During the forecast period, the transition toward renewable energy integration is expected to emerge as a major factor driving the expansion of the energy and utilities construction market by 2030. The global transition toward renewable energy sources such as solar and wind is increasing the need for new infrastructure. This includes the construction of renewable energy plants and upgrading transmission networks to handle variable energy inputs. Governments are promoting clean energy through incentives and policies, encouraging large-scale investments. Integration of renewables also requires energy storage systems and smart grid technologies. These developments significantly expand construction requirements. The push for sustainability continues to drive infrastructure expansion in this sector. • Modernization Of Aging Utility Infrastructure (Medium) – During the forecast period, the modernization of aging utility infrastructure is expected to act as a key growth catalyst for the energy and utilities construction market by 2030. Aging infrastructure in many regions is inefficient and prone to failures, creating a strong need for upgrades. Old grids, pipelines, and water systems require replacement to improve efficiency and reduce operational risks. Governments and utility providers are investing in modernization projects to enhance reliability and safety. Advanced technologies such as smart meters and automated systems are being implemented. These upgrades also help reduce energy losses and maintenance costs. Continuous refurbishment activities are driving sustained demand for construction services.How Will The Restraints Impact Growth In The Global Energy And Utilities Construction Market?
• High Capital Investment Requirements (Medium) – During the forecast period, high capital investment requirements are restricting the growth of the energy and utilities construction market. Large upfront costs associated with infrastructure development, financing constraints, and long return on investment cycles are limiting the ability of companies and governments to initiate and complete projects. • Regulatory And Environmental Compliance Challenges (Medium) – During the forecast period, regulatory and environmental compliance challenges are restricting the growth of the energy and utilities construction market. Stringent approval processes, environmental impact assessments, and evolving regulatory frameworks are delaying project approvals and increasing compliance costs for developers and contractors. • Supply Chain Disruptions And Resource Constraints (Medium) – During the forecast period, supply chain disruptions and resource constraints are restricting the growth of the energy and utilities construction market. Fluctuations in raw material availability, transportation bottlenecks, and shortages of skilled labor are causing delays, increasing project costs, and impacting overall project execution efficiency.Key Players In The Global Energy And Utilities Construction Market
Major companies operating in the energy and utilities construction market are BASF SE, Fluor Corporation, AECOM, Sika AG, TechnipFMC plc, McDermott International Ltd., KBR Inc., Huntsman Corporation, NPL Construction Co., Ashland Inc., GCP Applied Technologies Inc., Master Builders Solutions Deutschland GmbH, BlackEagle Energy Services LLC, Denbow Company Inc., Mapei SpA, Skanska UK Plc, Jacobs Engineering Group Inc., Larsen & Toubro Limited, John Wood Group PLC, Bechtel Corporation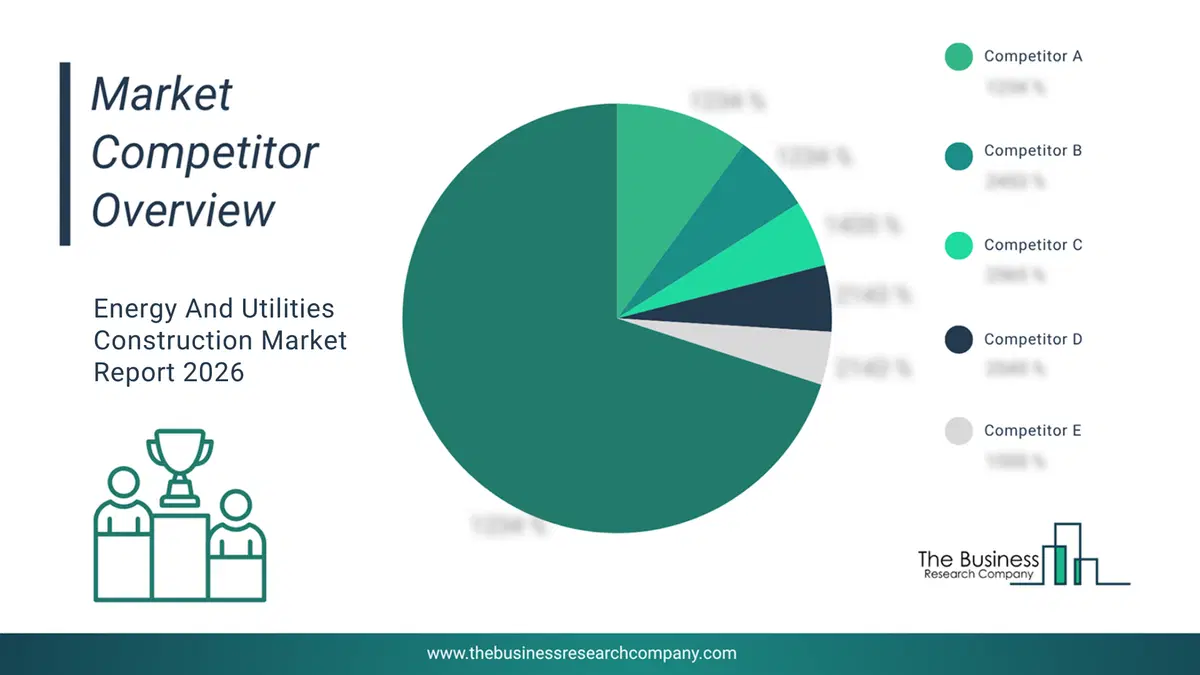
This chart is for illustrative purposes; the full report includes a detailed competitor analysis and comprehensive overview of the top 10 companies in the market.
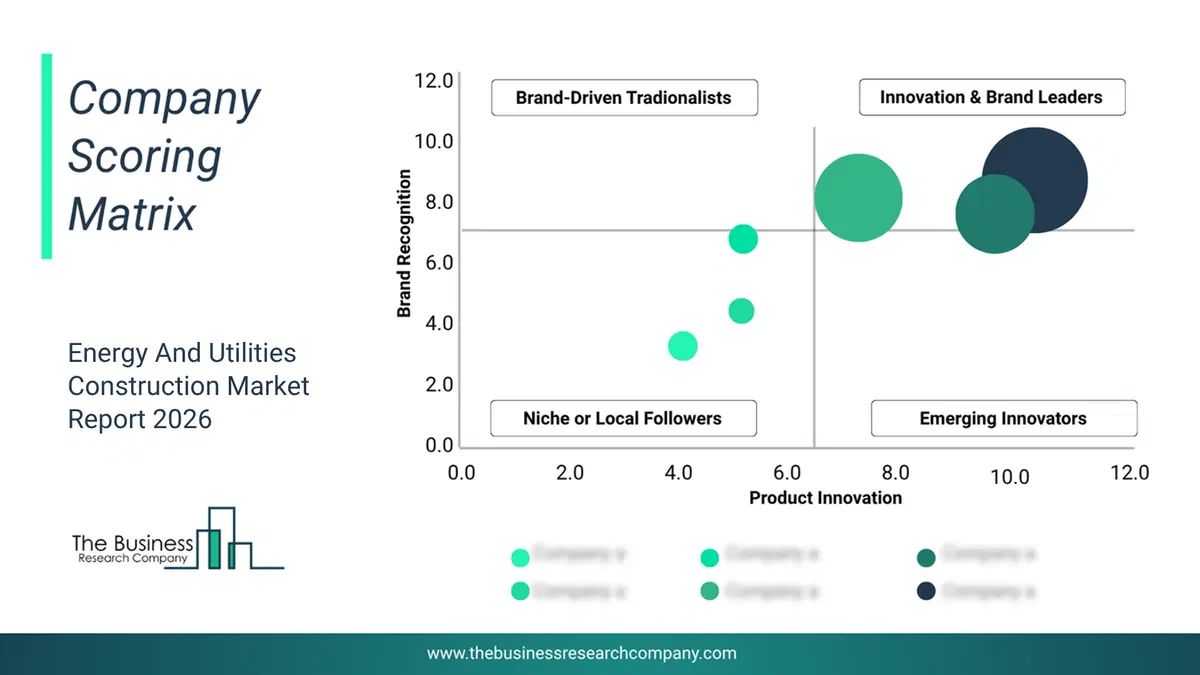
This chart maps companies by product innovation and brand strength, with bubble size indicating relative revenue, helping identify market leaders, challengers, and niche players. This is an illustrative chart; the full report provides a complete and accurate competitive analysis.
Global Energy And Utilities Construction Market Trends and Insights
Major companies operating in the energy and utilities construction market are focusing on developing innovative solutions, such as large-scale solar and wind power projects, to meet the rising demand for renewable energy integration and sustainable infrastructure development. Large-scale solar and wind projects involve the deployment of photovoltaic panels, solar thermal systems, or wind turbines at utility-scale capacities, allowing for cleaner energy production compared with traditional fossil fuel-based power plants, which rely on combustion and emit higher levels of greenhouse gases. For instance, in October 2025, ACWA Power, a Saudi Arabia-based developer, investor, and operator of power and desalinated water plants, launched a series of clean energy projects worth USD 10 billion, aimed at expanding renewable energy generation and financing innovative infrastructure solutions post-2022. These projects include solar and wind power installations designed to maximize energy output, reduce carbon emissions, and provide scalable, cost-effective alternatives to conventional energy production. The initiatives leverage advanced technology for grid integration, energy storage readiness, and operational efficiency, benefiting utility operators, governments, and communities by providing reliable and sustainable electricity supply.What Are Latest Mergers And Acquisitions In The Energy And Utilities Construction Market?
In March 2025, Willdan Group Inc., a US-based consulting services company, acquired Alternative Power Generation, Inc. for an undisclosed amount. With this acquisition, Willdan Group, Inc. aims to enhance its electrical engineering and construction management capabilities to support better the evolving energy transition and the growing demand for resilient power solutions. Alternative Power Generation, Inc. is a US-based company specializing in engineering and construction services.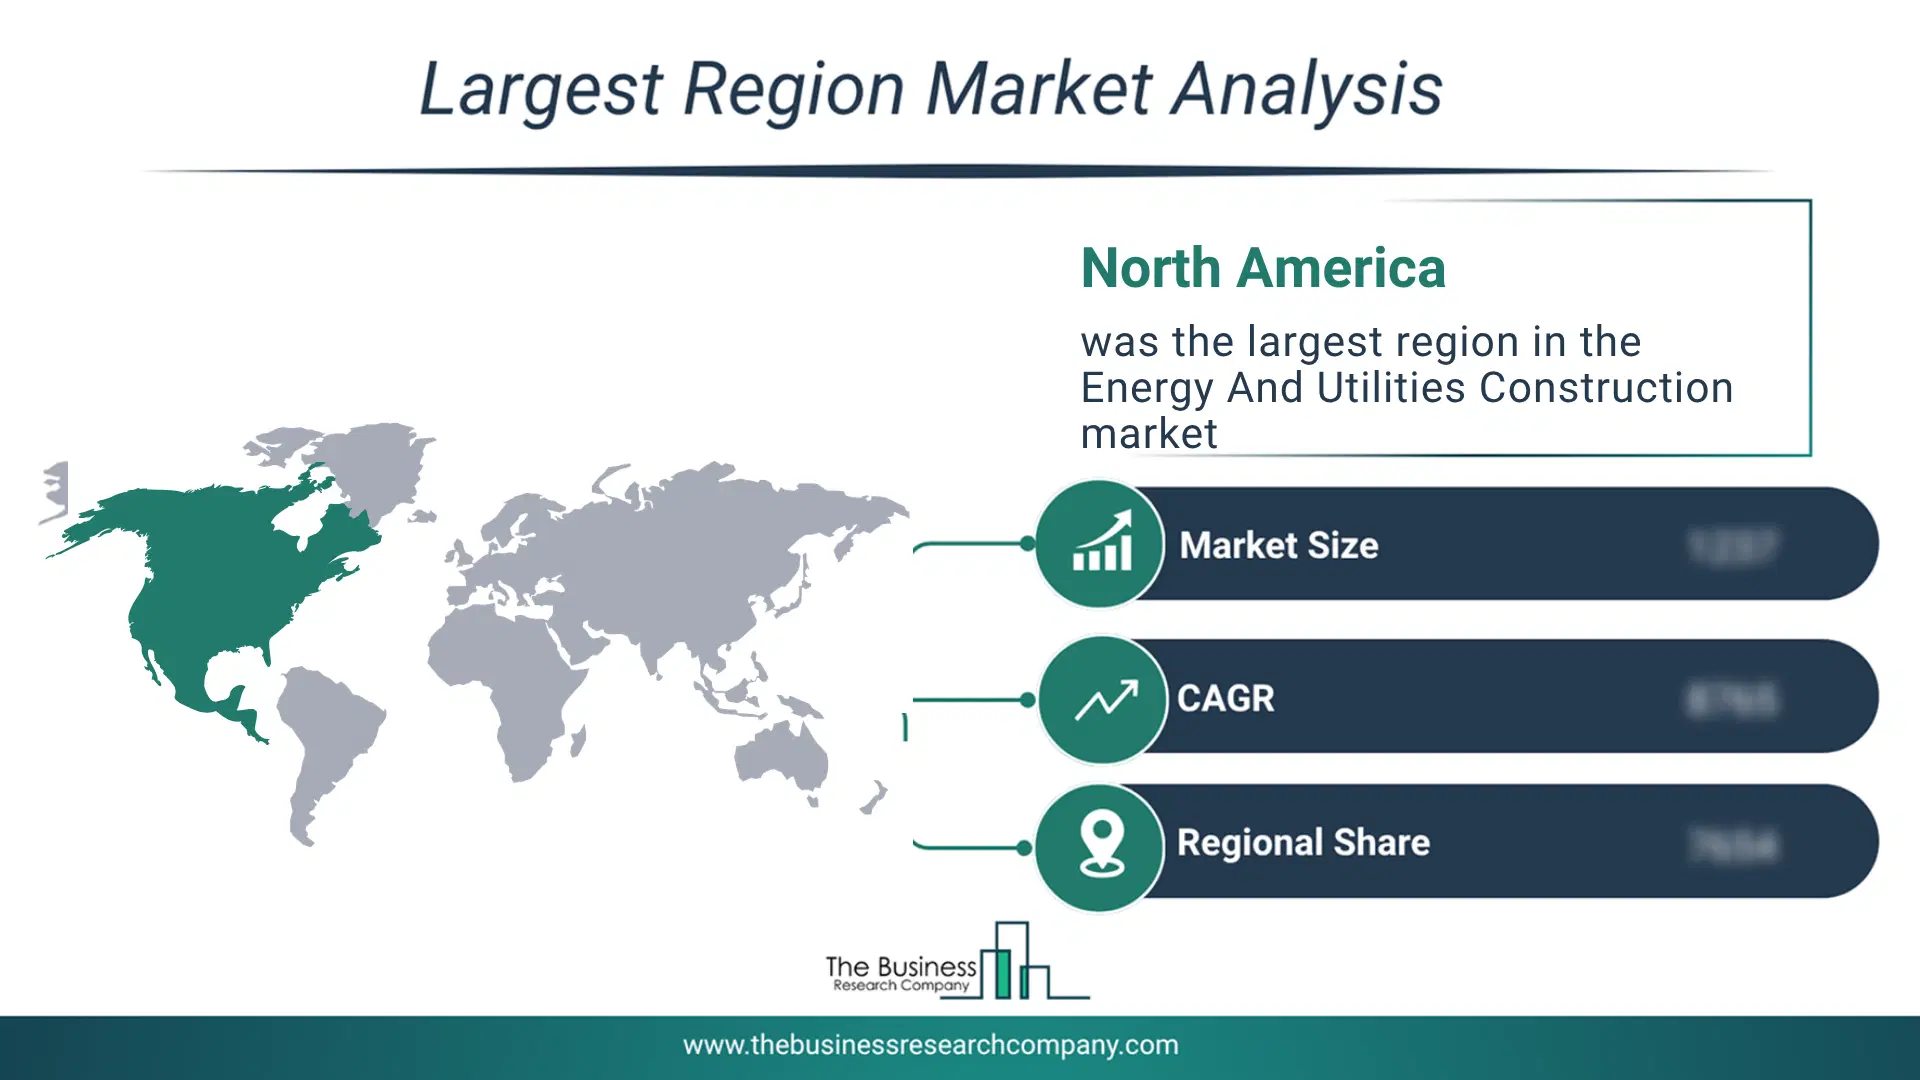
Regional Outlook
North America was the largest region in the energy and utilities construction market in 2025. The regions covered in this market report are Asia-Pacific, South East Asia, Western Europe, Eastern Europe, North America, South America, Middle East, Africa The countries covered in this market report are Australia, Brazil, China, France, Germany, India, Indonesia, Japan, Taiwan, Russia, South Korea, UK, USA, Canada, Italy, Spain.What Defines the Energy And Utilities Construction Market?
The energy and utilities construction market consists of revenues earned by entities providing services such as modernization of aging infrastructure, grid planning, and performance monitoring. The market value includes the value of related goods sold by the service provider or included within the service offering. The energy and utilities construction market also includes sales of wind turbines, grid modernization equipment, and water distribution pipelines. Values in this market are ‘factory gate’ values, that is, the value of goods sold by the manufacturers or creators of the goods, whether to other entities (including downstream manufacturers, wholesalers, distributors, and retailers) or directly to end customers. The value of goods in this market includes related services sold by the creators of the goods.How is Market Value Defined and Measured?
The market value is defined as the revenues that enterprises gain from the sale of goods and/or services within the specified market and geography through sales, grants, or donations in terms of the currency (in USD unless otherwise specified). The revenues for a specified geography are consumption values that are revenues generated by organizations in the specified geography within the market, irrespective of where they are produced. It does not include revenues from resales along the supply chain, either further along the supply chain or as part of other products.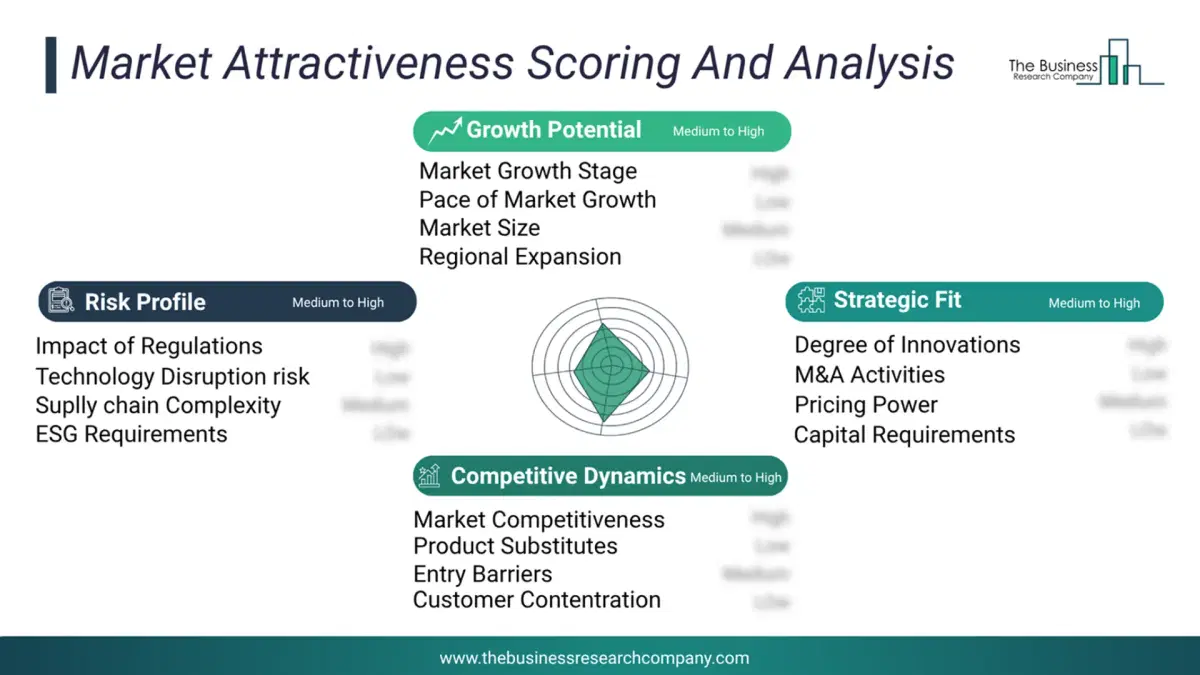
This chart presents market attractiveness based on a quantitative evaluation of growth, competition, strategic alignment, and risk, offering a clear view of opportunity areas for decision-making. This chart is for illustrative purposes; the full report contains the complete analysis.
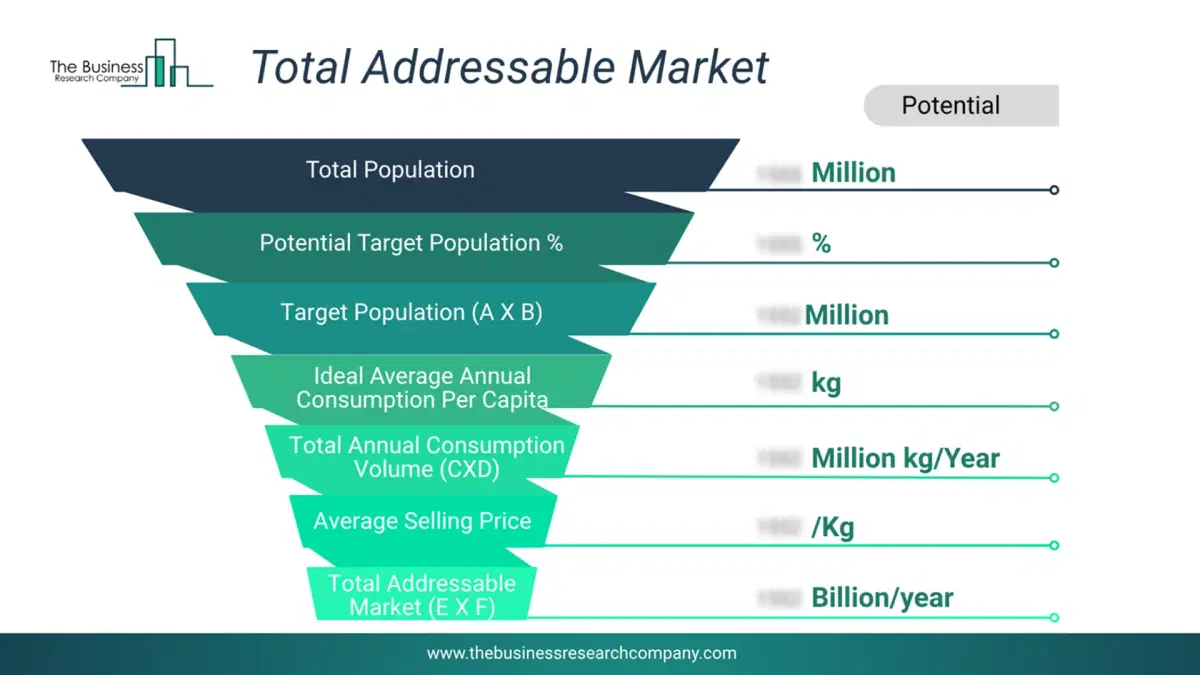
This chart highlights the Total Addressable Market (TAM) by estimating the maximum revenue opportunity using an assumption-driven approach, supporting strategic planning and opportunity sizing across markets. The chart is illustrative; the full report provides a more comprehensive analysis.
What Key Data and Analysis Are Included in the Energy And Utilities Construction Market Report 2026?
The energy and utilities construction market research report is one of a series of new reports from The Business Research Company that provides market statistics, including industry global market size, regional shares, competitors with the market share, detailed market segments, market trends and opportunities, and any further data you may need to thrive in the energy and utilities construction industry. The market research report delivers a complete perspective of everything you need, with an in-depth analysis of the current and future state of the industry.Energy And Utilities Construction Market Report Forecast Analysis
| Report Attribute | Details |
|---|---|
| Market Size Value In 2026 | $151.68 billion |
| Revenue Forecast In 2030 | $208.73 billion |
| Growth Rate | CAGR of 8.6% from 2026 to 2030 |
| Base Year For Estimation | 2025 |
| Actual Estimates/Historical Data | 2020-2025 |
| Forecast Period | 2026 - 2030 |
| Market Representation | Revenue in USD Billion and CAGR from 2026 to 2030 |
| Segments Covered | Type, Technology, Scale of Project, Application, End-Users |
| Regional Scope | Asia-Pacific, Western Europe, Eastern Europe, North America, South America, Middle East, Africa |
| Country Scope | The countries covered in the report are Australia, Brazil, China, France, Germany, India, Indonesia, Japan, Taiwan, Russia, South Korea, UK, USA, Canada, Italy, Spain. |
| Key Companies Profiled | BASF SE, Fluor Corporation, AECOM, Sika AG, TechnipFMC plc, McDermott International Ltd., KBR Inc., Huntsman Corporation, NPL Construction Co., Ashland Inc., GCP Applied Technologies Inc., Master Builders Solutions Deutschland GmbH, BlackEagle Energy Services LLC, Denbow Company Inc., Mapei SpA, Skanska UK Plc, Jacobs Engineering Group Inc., Larsen & Toubro Limited, John Wood Group PLC, Bechtel Corporation |
| Customization Scope | Request for Customization |
| Pricing And Purchase Options | Explore Purchase Options |